23.2 Volcano plots with EnhancedVolcano package
Volcano plots are a type of scatter plot used to visualize significant changes in large datasets: in our use case, we can use volcano plots to highlight top differentially expressed genes.
A Volcano plots shows:
- Fold Changes on the x-axis
- P-values on the y-axis (in
-log10scale)
if (!requireNamespace('BiocManager', quietly = TRUE))
  install.packages('BiocManager')

BiocManager::install('EnhancedVolcano')
Load package:
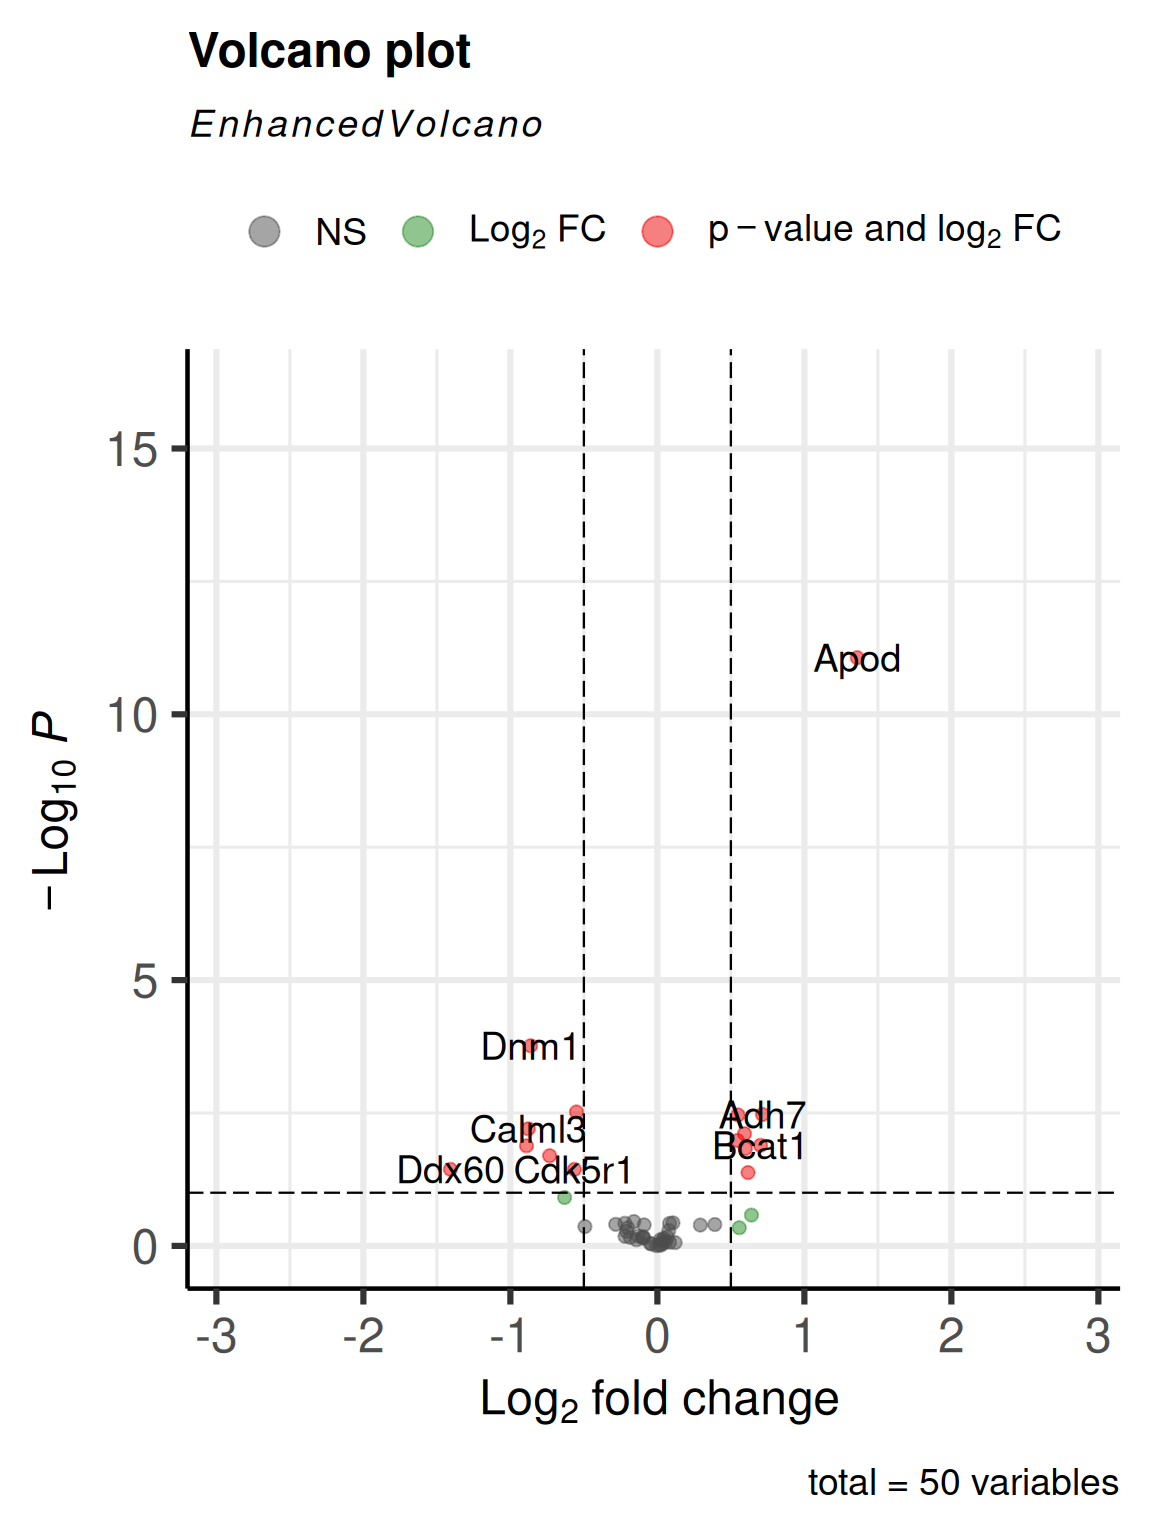
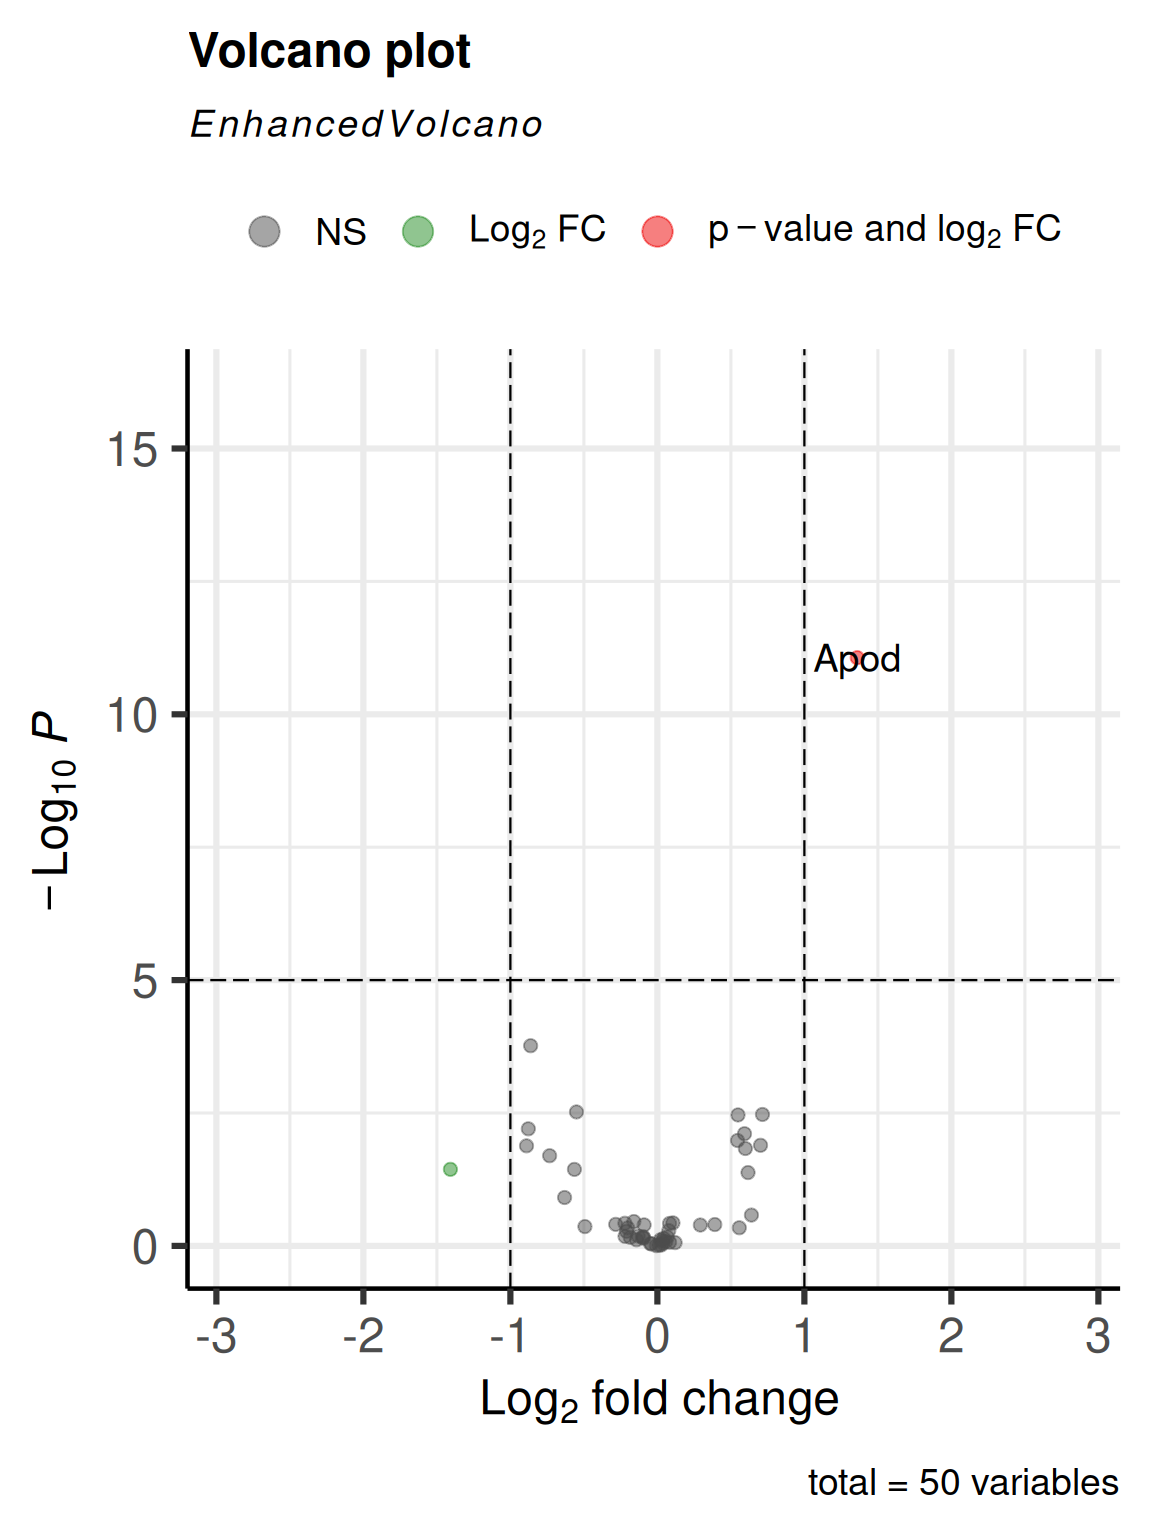
Use default parameters:
Change default cutoffs:
EnhancedVolcano(geneexp,
    lab = geneexp$GeneSymbol,
    x = 'log2FoldChange',
    y = 'padj',
    pCutoff=0.1,
    FCcutoff=0.5)