13.2 Bar positions
We can modify the bars position. By default, position is stack, i.e. categories are stacked on top of each other.
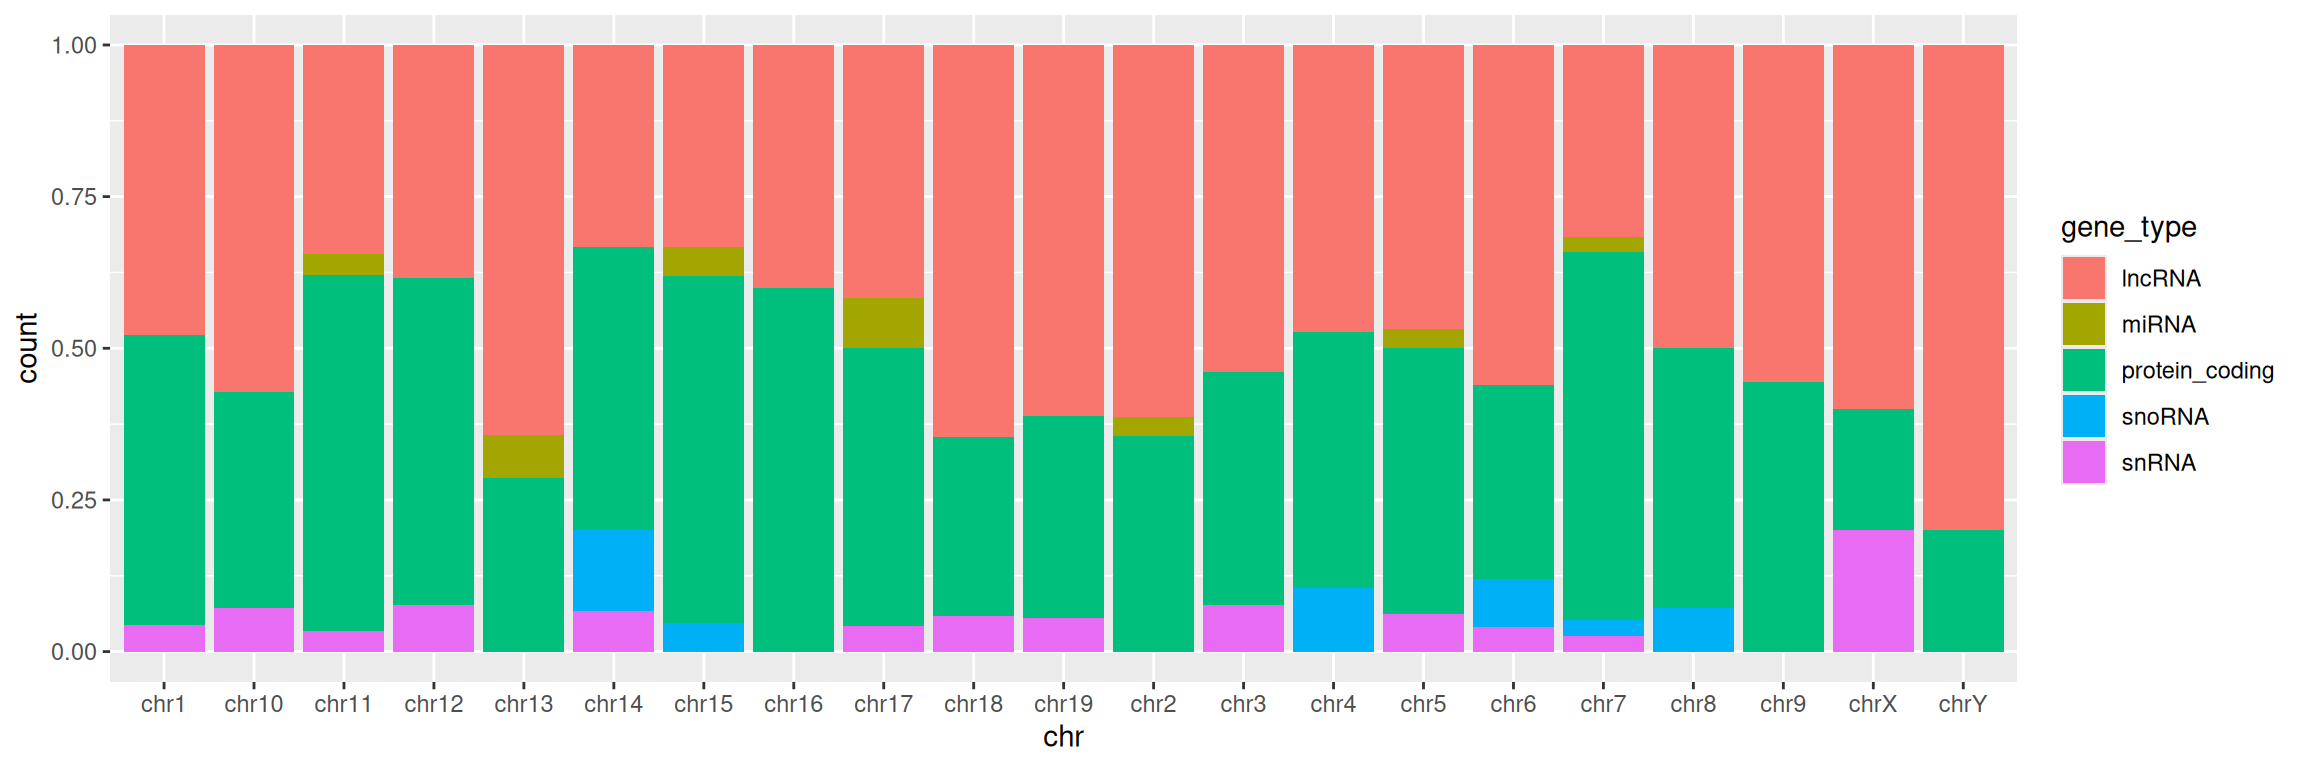
Position fill scales data so the upper bound is always 1, i.e. fill shows proportions, instead of absolute values:
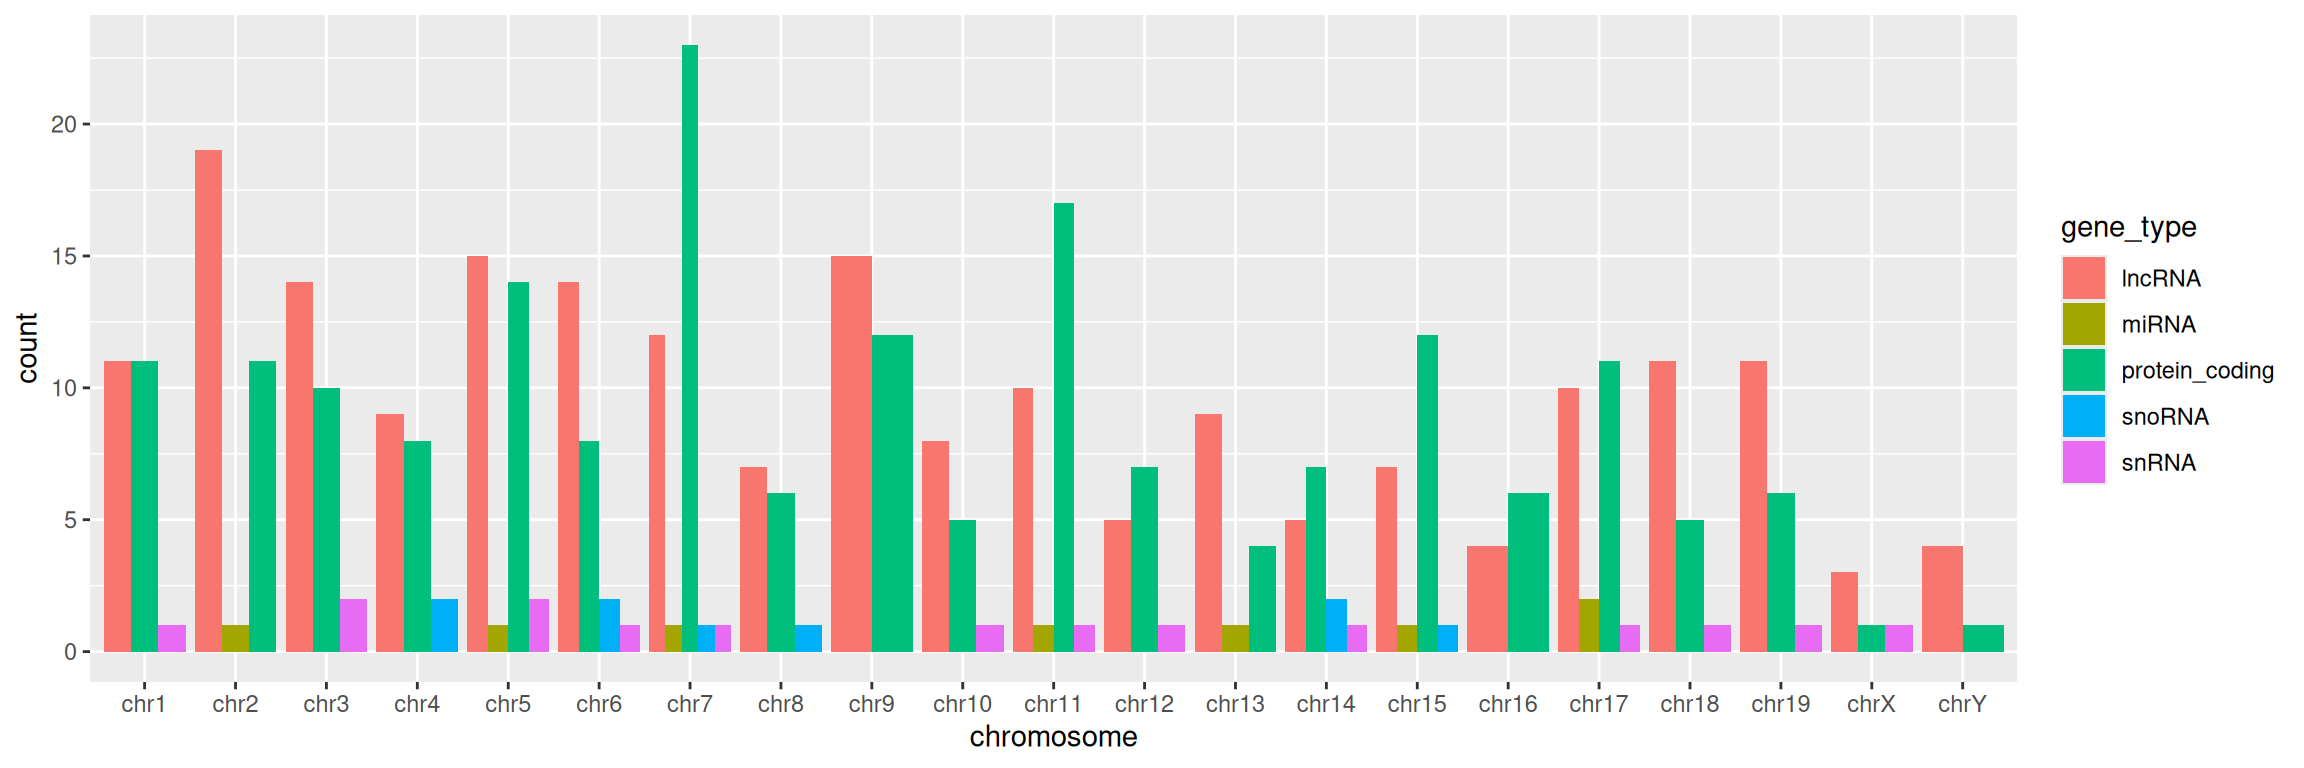
Position dodge organizes each category (here, gene types) side-by-side:
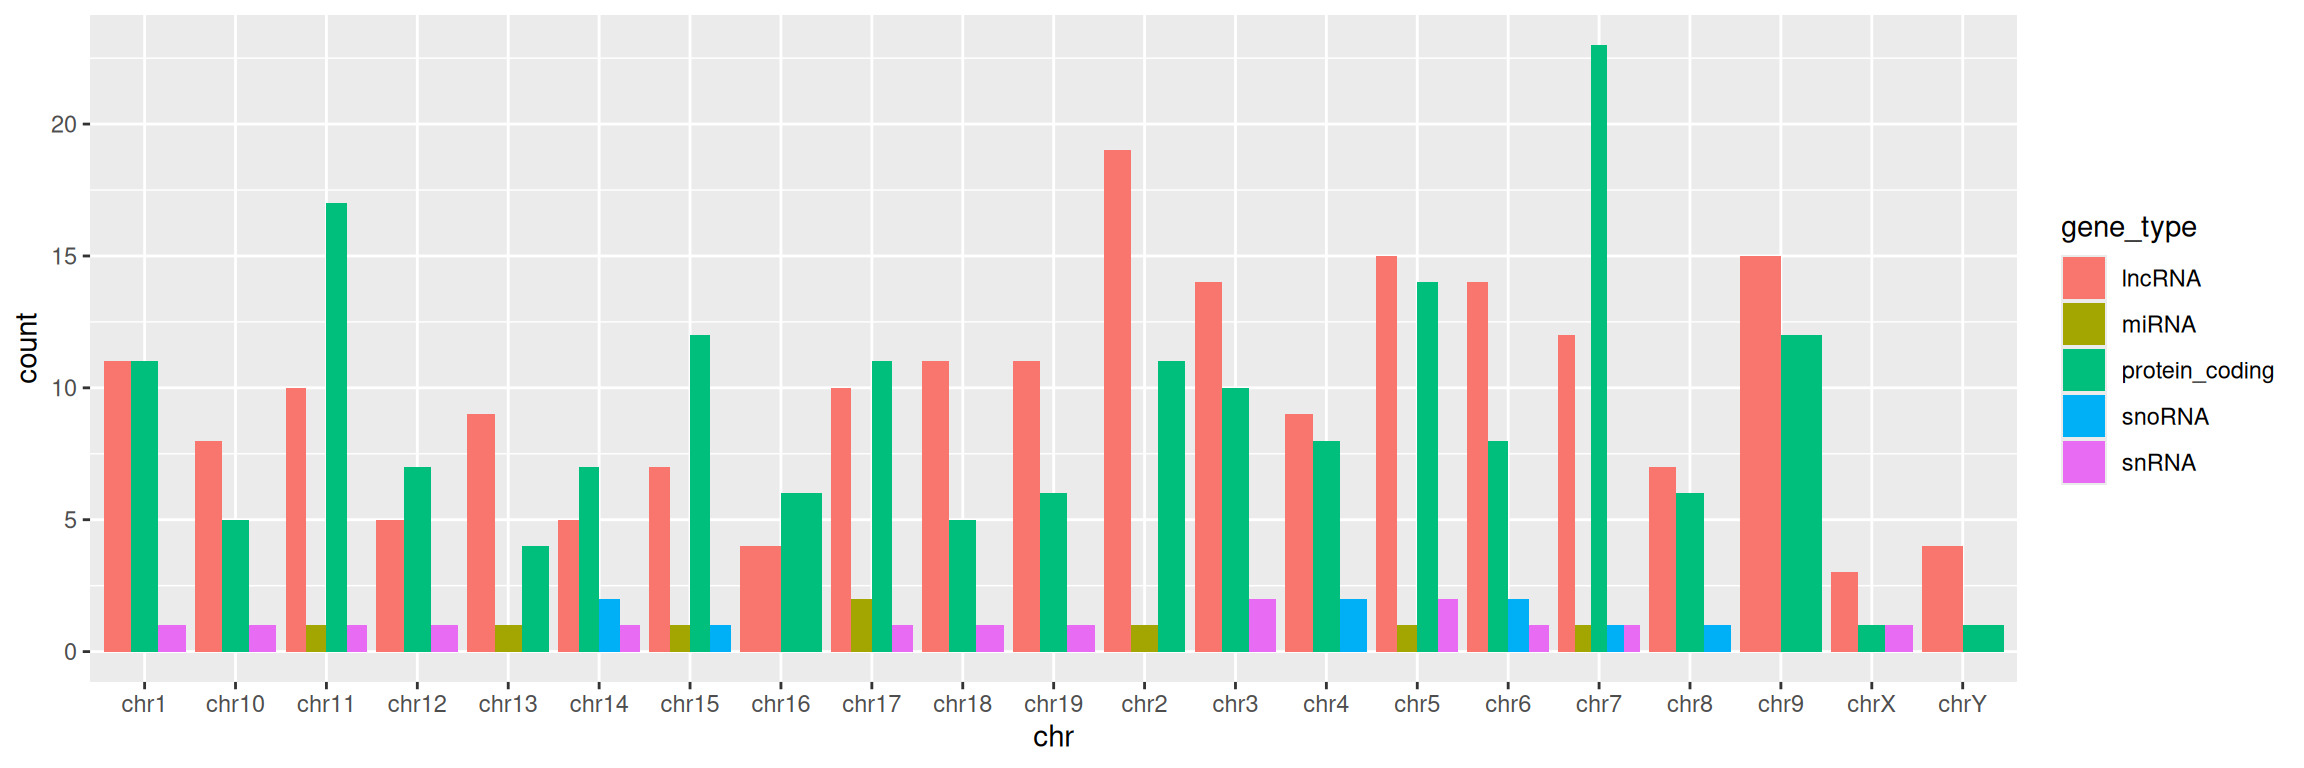
More advanced (as reference, or if someone asks): how to reorder x-axis labels:
Factors are a data type in R representing categorical data. Using factors requires a bit more understanding of how R works/thinks, but here is a useful application using ordered factors/categories to re-order bars in a barplot:
ggplot(data=gtf,
       mapping=aes(x=factor(chr, levels=c("chr1", "chr2", "chr3", "chr4", "chr5", "chr6", "chr7", "chr8", "chr9", "chr10", "chr11", "chr12", "chr13", "chr14", "chr15", "chr16", "chr17", "chr18", "chr19", "chrX", "chrY"), ordered=TRUE), fill=gene_type)) +
  geom_bar(position="dodge") +
  xlab("chromosome")