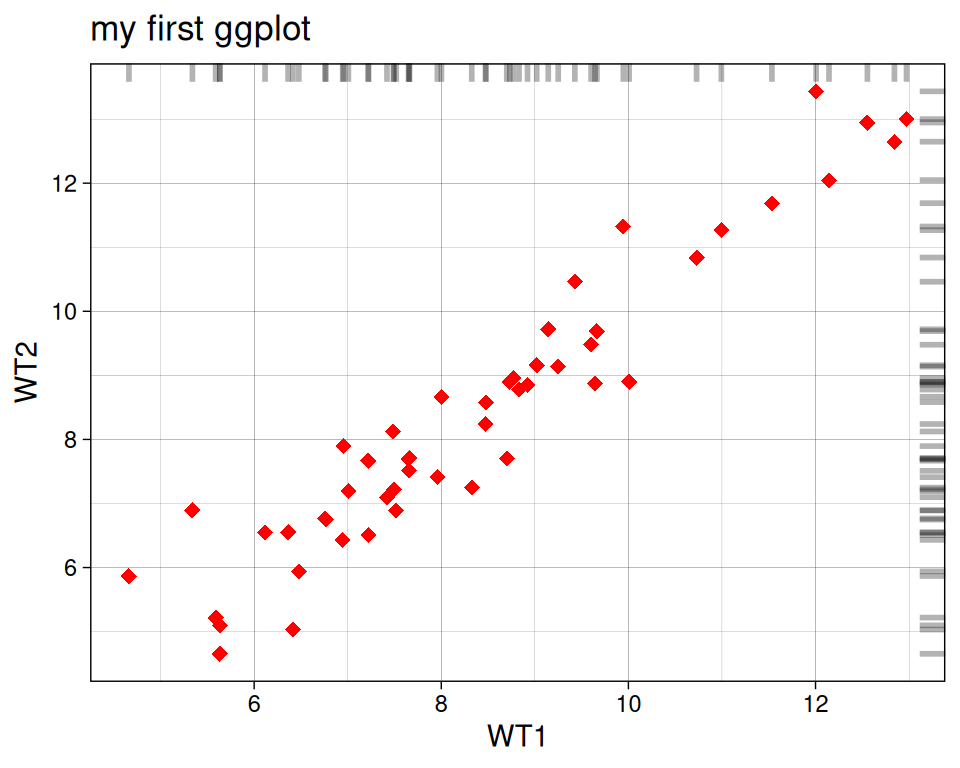
12.3 Additional ticks
geom_rug creates a compact visualization along the axes to help read the information of individual cases. You can simply add it as an additional layer.
ggplot(data=geneexp, mapping=aes(x=WT1, y=WT2)) +
  geom_point(color="red", size=2.5, shape="diamond") +
  ggtitle(label="my first ggplot") +
  theme_linedraw() +
  geom_rug()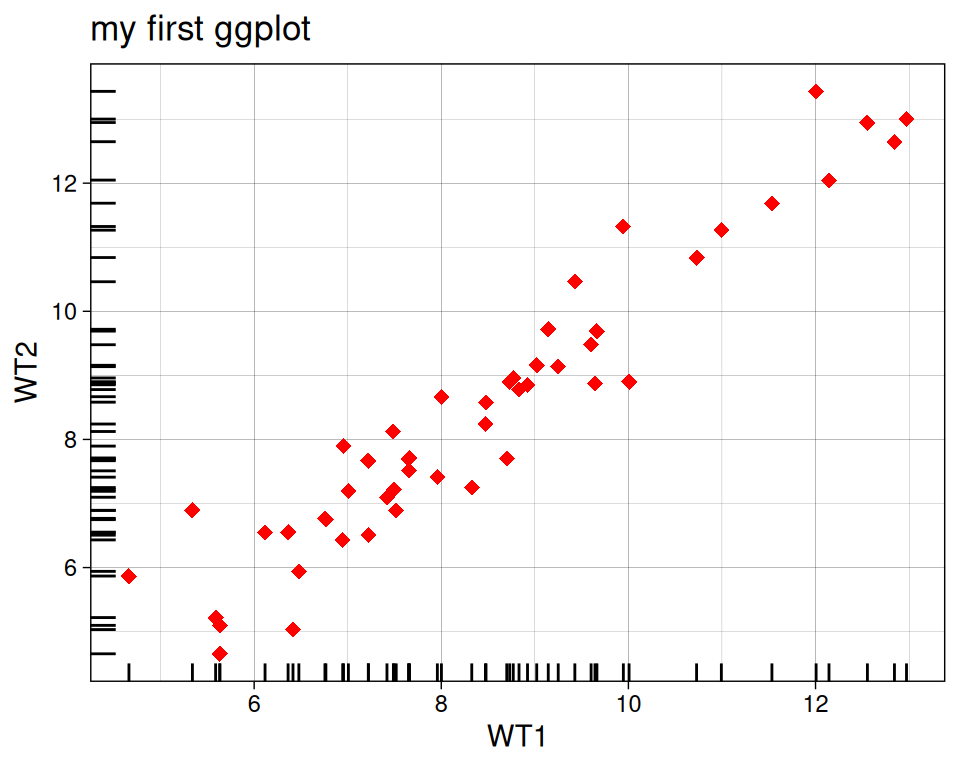
As usual, you can customize several parameters, such as:
- sides: sides where to draw the lines (top, bottom, right, left)
- alpha: opacity, ranges from 0 (transparent) to 1 (opaque).
- linewidth, linetype
ggplot(data=geneexp, mapping=aes(x=WT1, y=WT2)) +
  geom_point(color="red", size=2.5, shape="diamond") +
  ggtitle(label="my first ggplot") +
  theme_linedraw() +
  geom_rug(sides="tr", alpha=0.3, linewidth=1)