9.2 Customize the points
geom_point() can take parameters, including the point color and size:
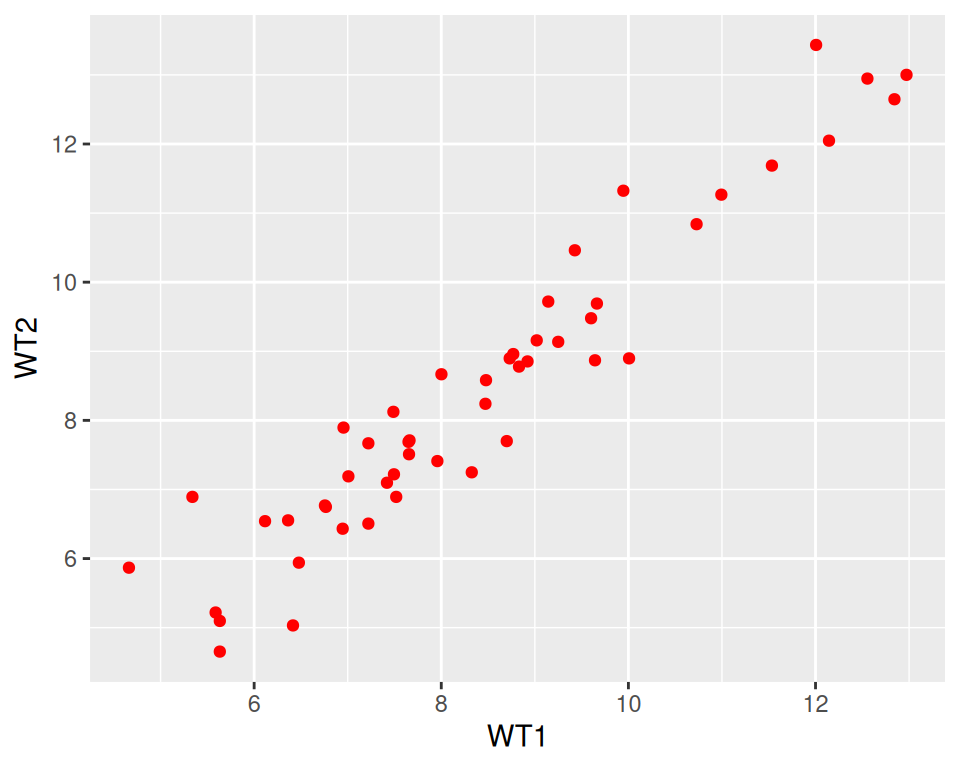
Color all points in red:
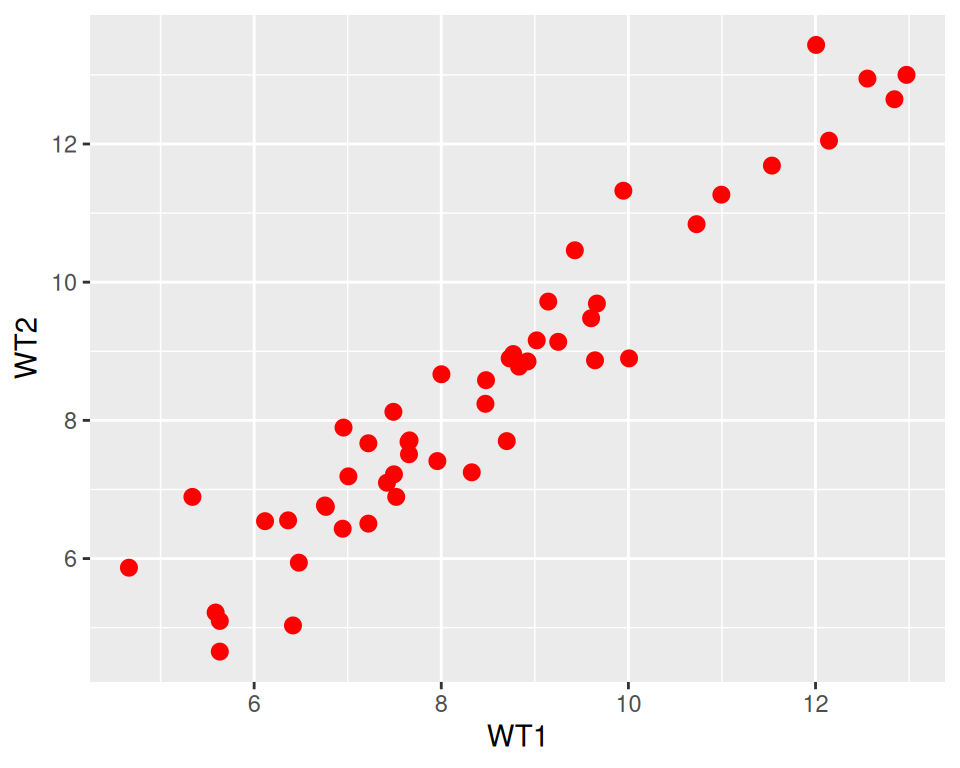
Increase point size (default size is 1.5):
How do you know how a function works?
Functions in ggplot2 (and tidyverse in general) are richly documented.
While documentation/help pages can be quite technical it is a good practice to take a look at them.
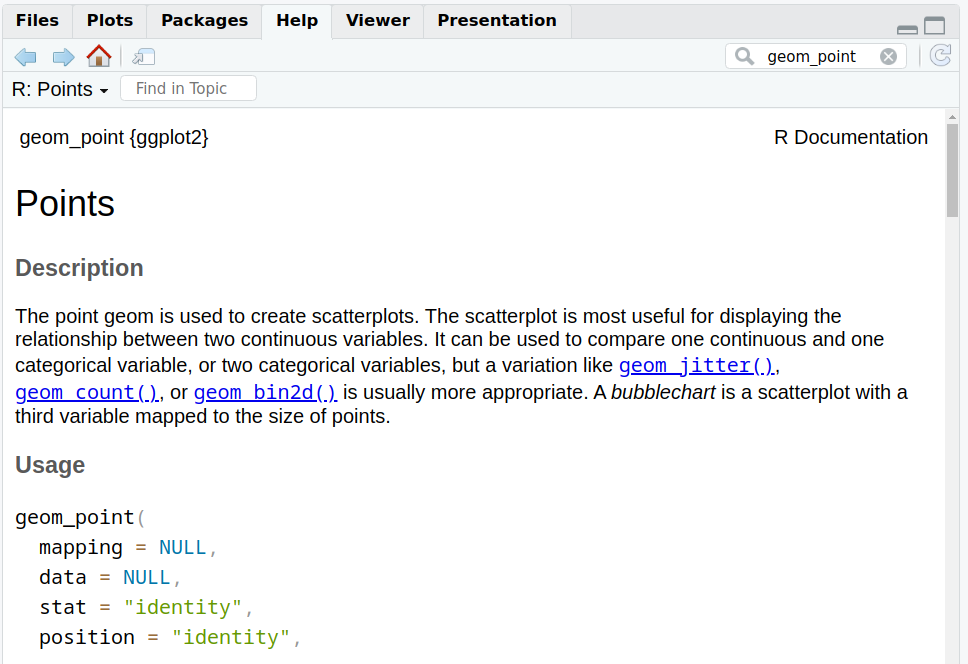
You can access the help page of a function in the Help tab in the bottom-right panel. Give it a try with “geom_point”:
Back to our customization: we can change the point shape by setting the shape parameter in geom_point().
Points can become, for example, triangles:
ggplot(data=geneexp, mapping=aes(x=WT1, y=WT2)) +
  geom_point(color="red", size=2.5, shape="triangle")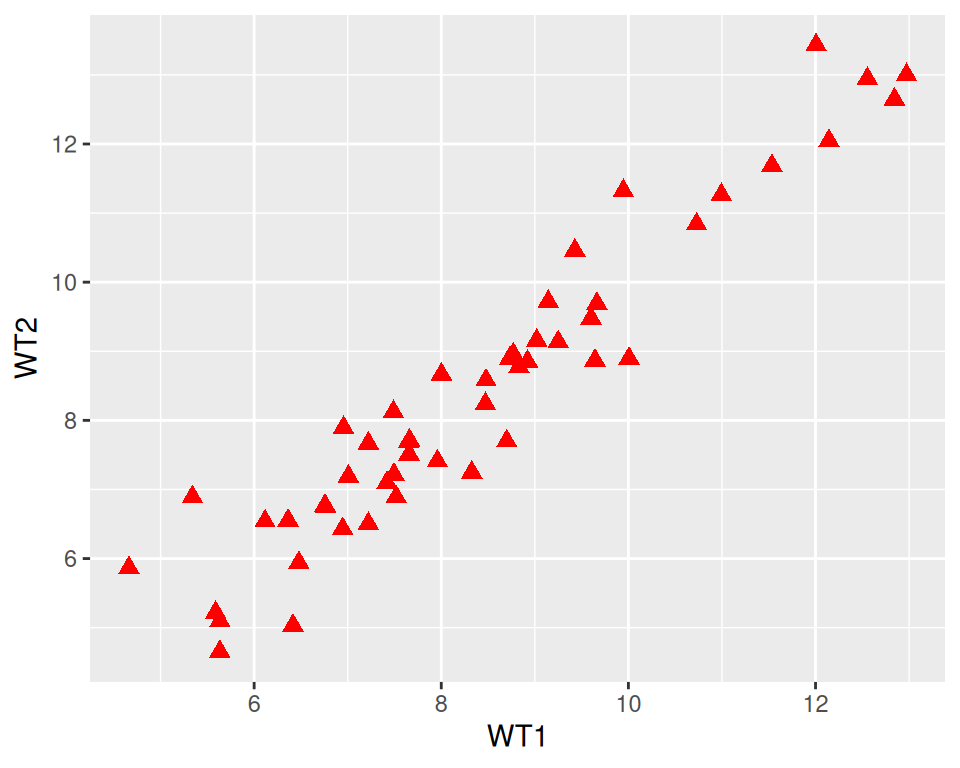
See more options in the following image:

Image from ggplot2 documentation
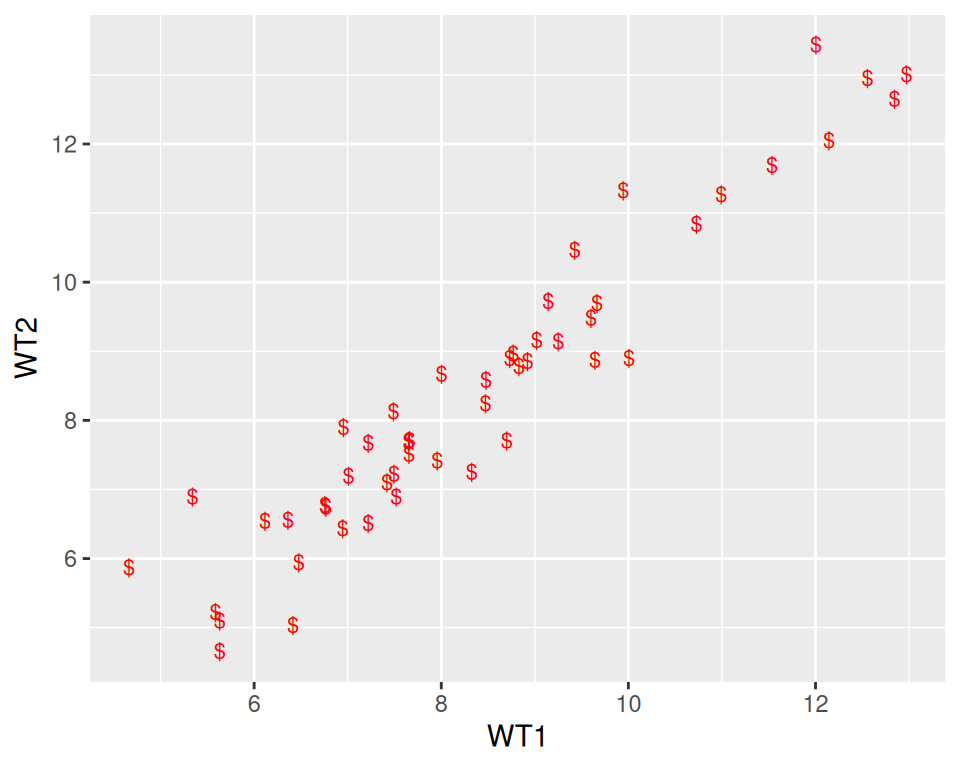
Note that you can also replace the points by any character, the following way: