21.1 The pipe operator
The tidyverse provides a function %>% which pipes the output of one function as the input of the next function.
This way, different functions from the tidyverse can be linked together into a clean piece of code.
In exercise 3, we produced the following 3 lines of code to get the data frame of interest:
gtf2 <- rename(gtf, chromosome=chr)
gtf3 <- filter(gtf2, strand=="+" & chromosome=="chr4")
gtf4 <- select(gtf3, gene_symbol, gene_type)
You can create the same object linking these commands with the pipe %>%:
gtf_final <- rename(gtf, chromosome=chr) %>%
  filter(strand=="+" & chromosome=="chr4") %>%
  select(gene_symbol, gene_type)
Note that in filter and select you do not need to specify the first parameter (the data), as it is automatically using the output from the previous command!
If you want to learn more about the pipe, you can for example refer to that page.
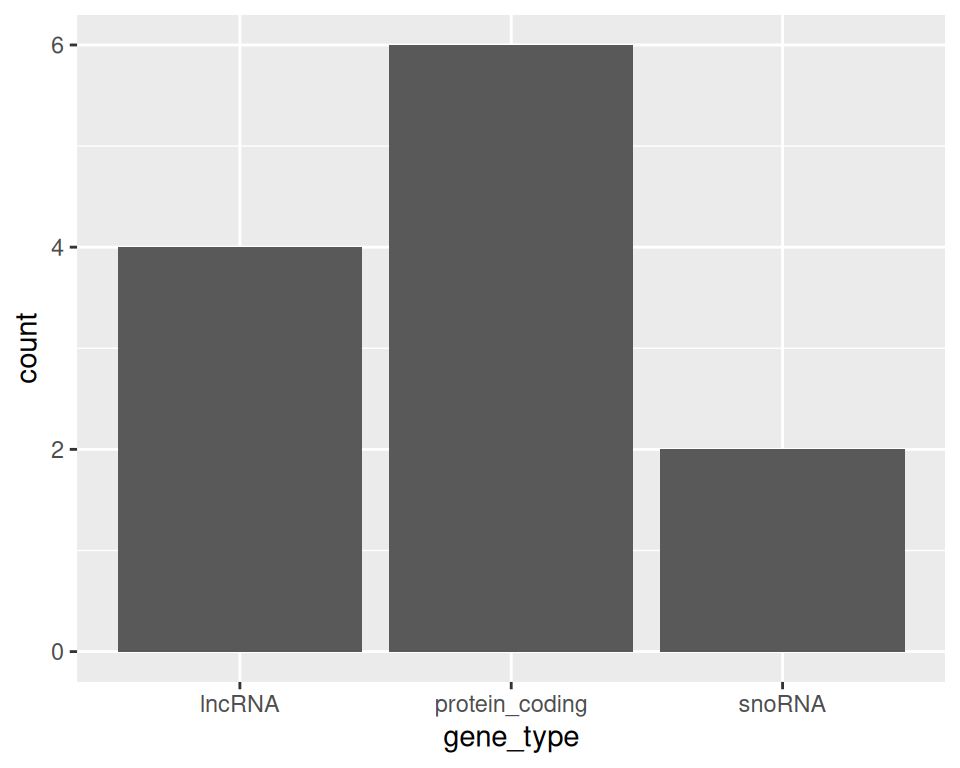
Note that we can also link the data manipulation output to ggplot: the output of the last command will then be used as an input to ggplot:
rename(gtf, chromosome=chr) %>%
  filter(strand=="+" & chromosome=="chr4") %>%
  select(gene_symbol, gene_type) %>%
  ggplot(aes(x=gene_type)) + geom_bar()