10.2 Backgrounds
Not a big fan of the default grey background?
This is the default “theme”, but there are more options.
Examples:
ggplot(data=geneexp, mapping=aes(x=WT1, y=WT2)) +
  geom_point(color="red", size=2.5, shape="diamond") +
  ggtitle(label="theme grey (the default theme)") +
  theme_grey()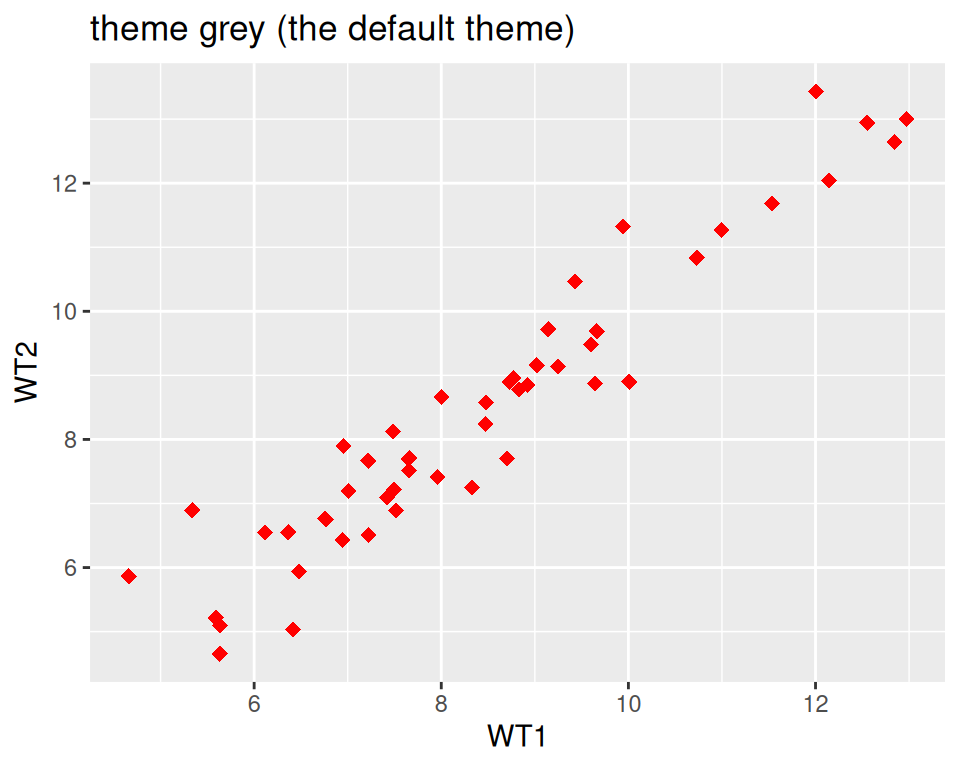
ggplot(data=geneexp, mapping=aes(x=WT1, y=WT2)) +
  geom_point(color="red", size=2.5, shape="diamond") +
  ggtitle(label="theme linedraw") +
  theme_linedraw()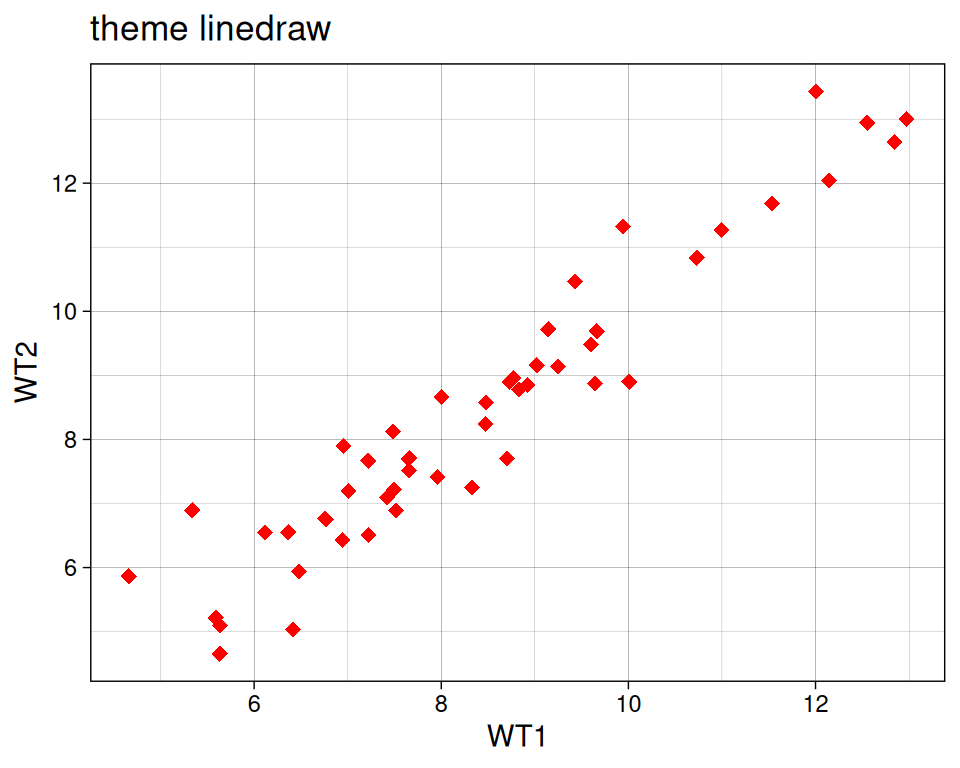
ggplot(data=geneexp, mapping=aes(x=WT1, y=WT2)) +
  geom_point(color="red", size=2.5, shape="diamond") +
  ggtitle(label="theme bw = black and white") +
  theme_bw()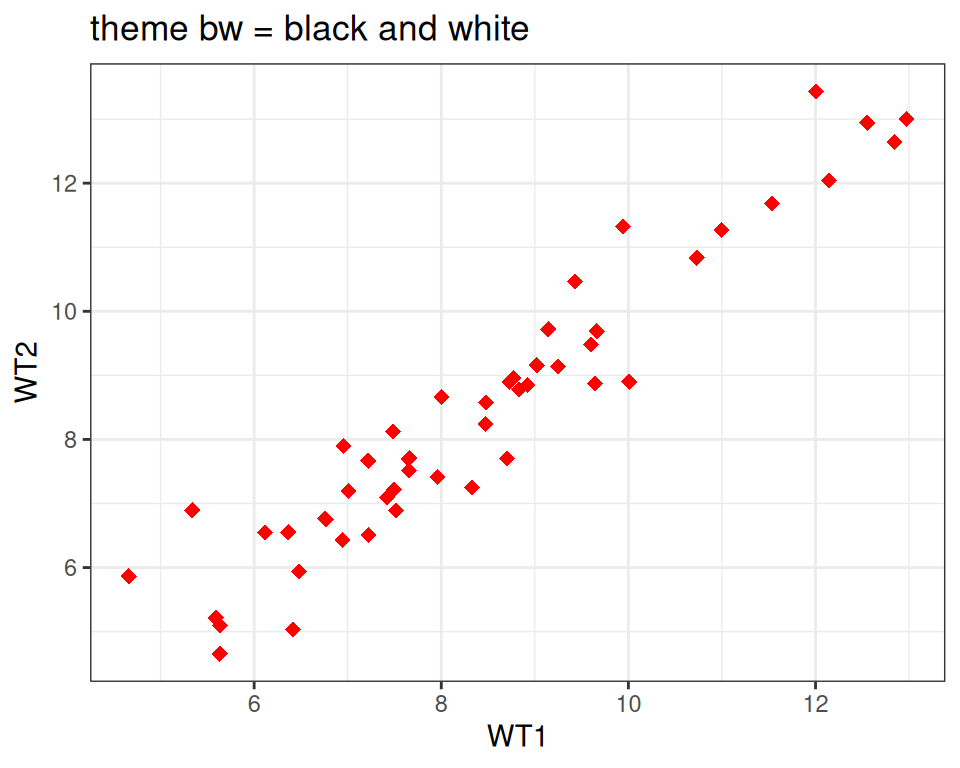
ggplot(data=geneexp, mapping=aes(x=WT1, y=WT2)) +
  geom_point(color="red", size=2.5, shape="diamond") +
  ggtitle(label="theme void") +
  theme_void()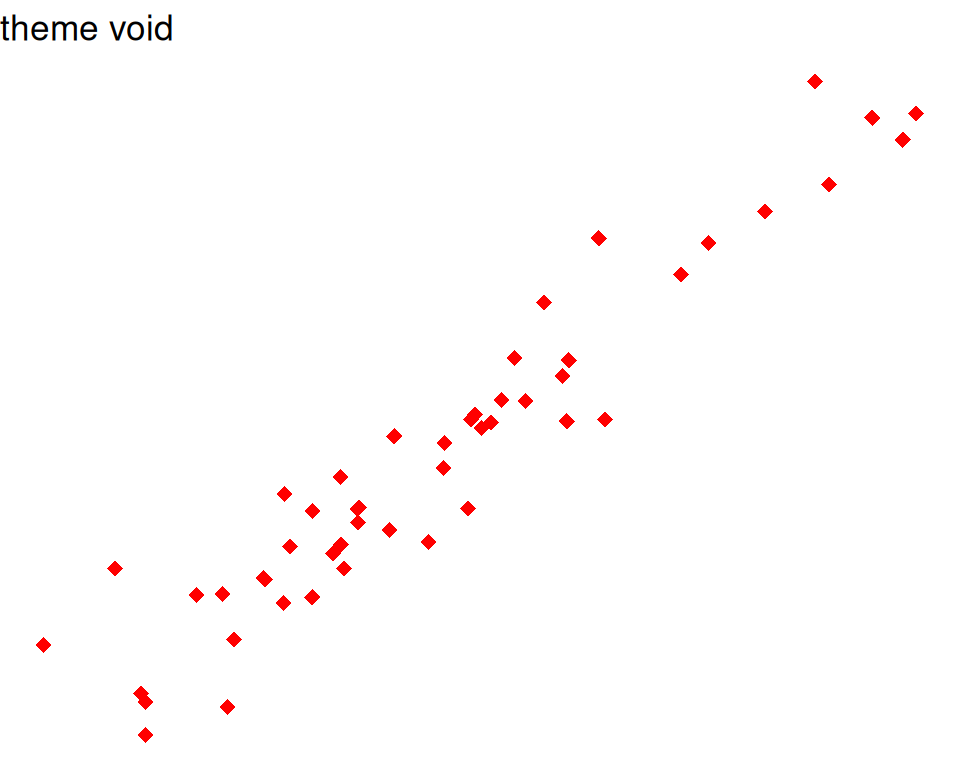
Good webpage to check the different backgrounds: https://ggplot2-book.org/themes#sec-theme
You can also change some settings globally as you use a new theme, e.g.
- base_size: by default, 11.
- base_line_size: by default, base_size/22.
- base_rect_size: by default, base_size/22
# get full list of available fonts in your system with:
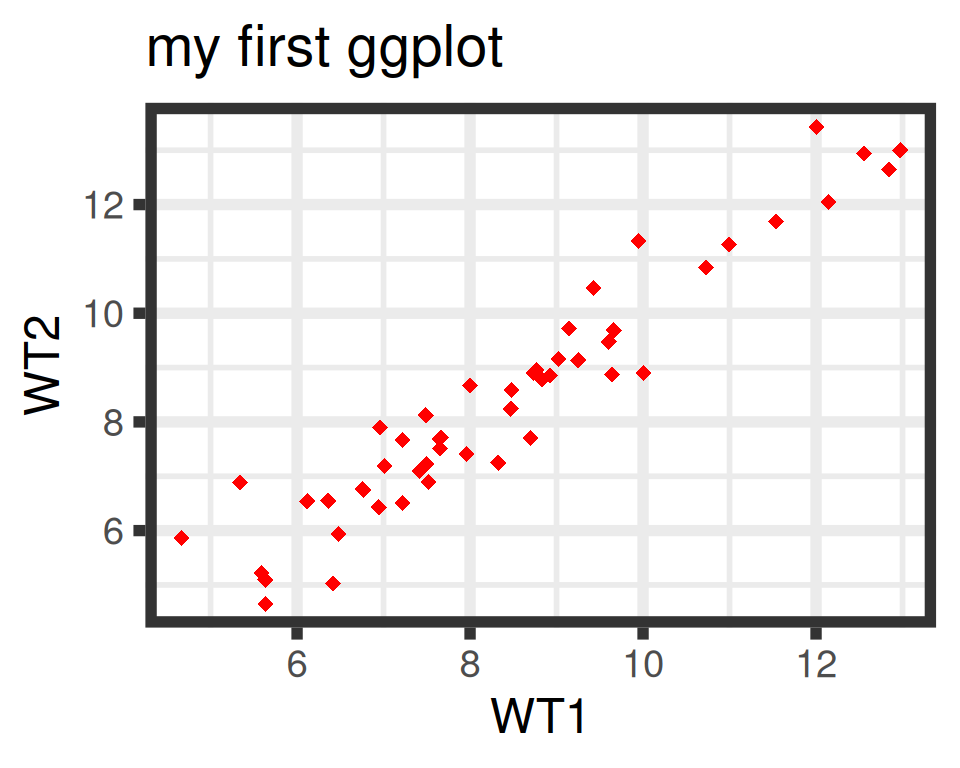
ggplot(data=geneexp, mapping=aes(x=WT1, y=WT2)) +
geom_point(color="red", size=2.5, shape="diamond") +
ggtitle(label="my first ggplot") +
theme_bw(base_size=18, base_line_size = 2, base_rect_size = 4)