18.3 RColorBrewer
You can easily pick palettes from the RColorBrewer package, that is included in ggplot2.
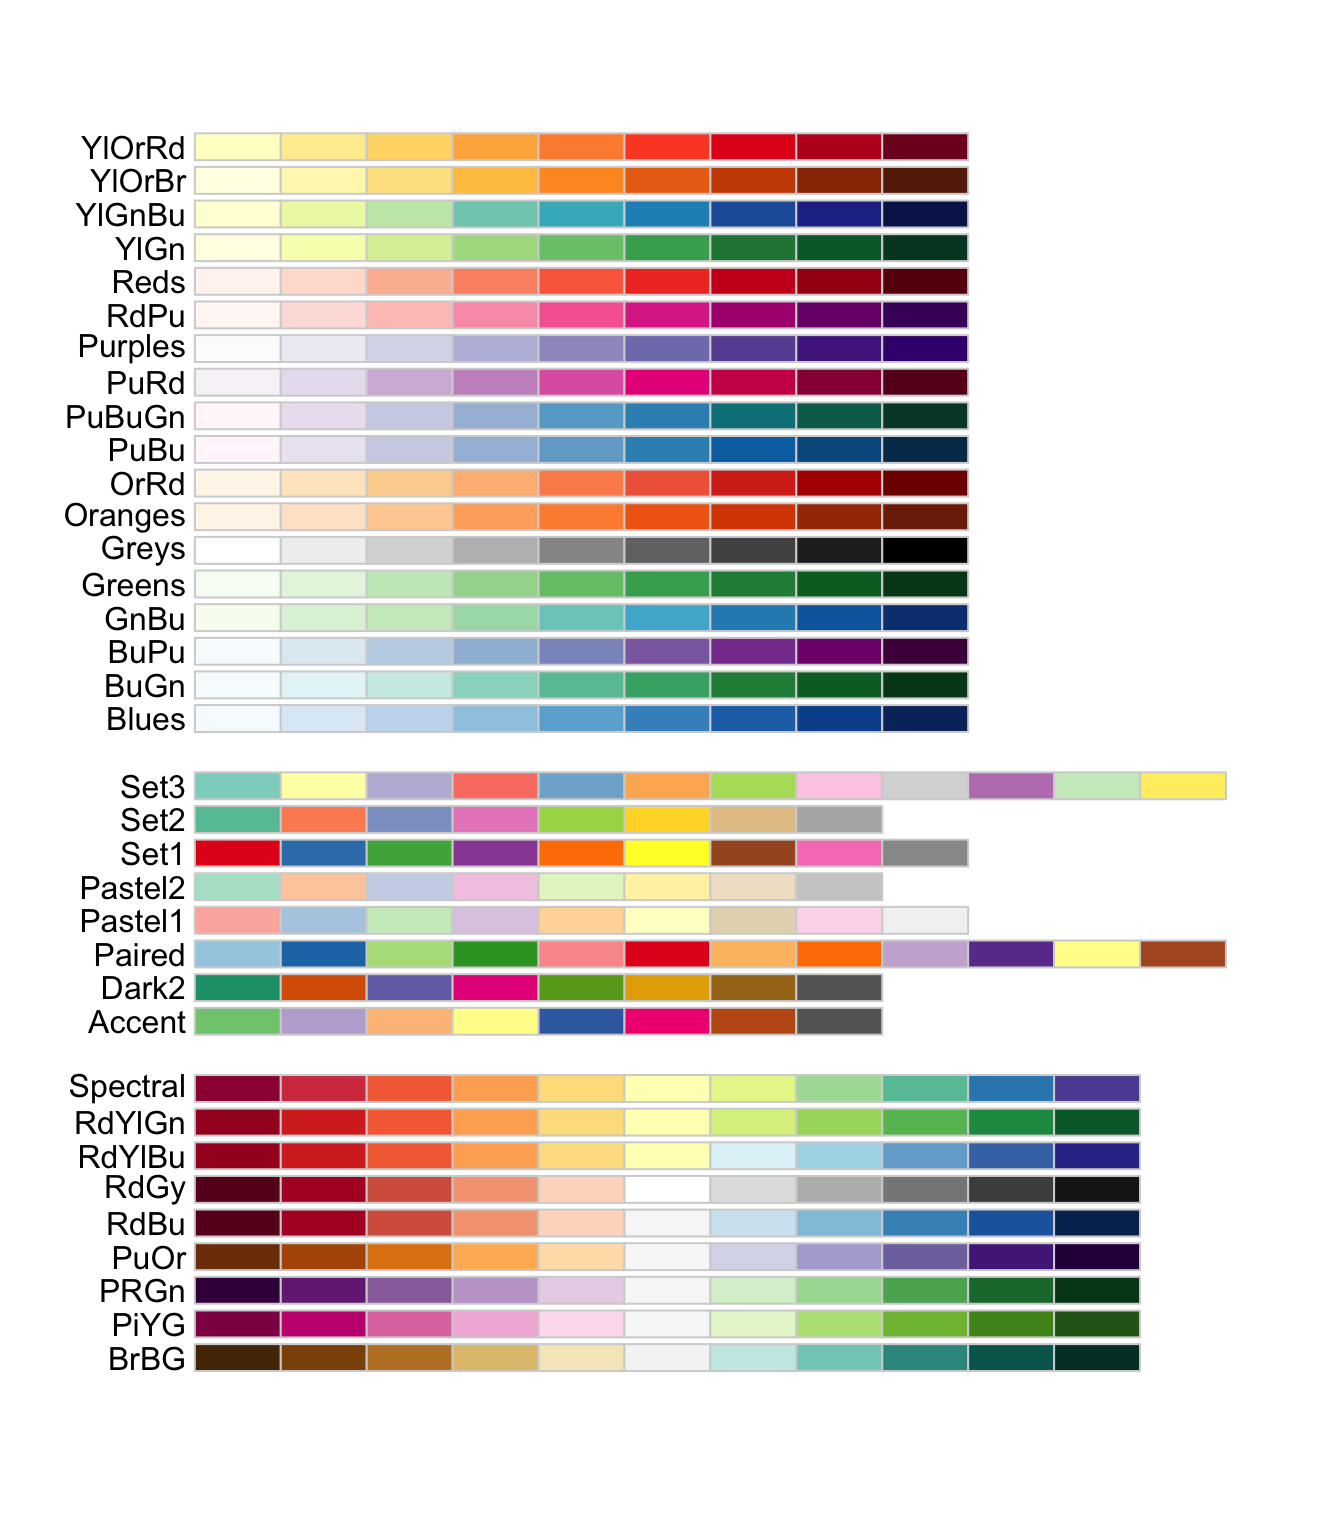
Available palettes are shown below:
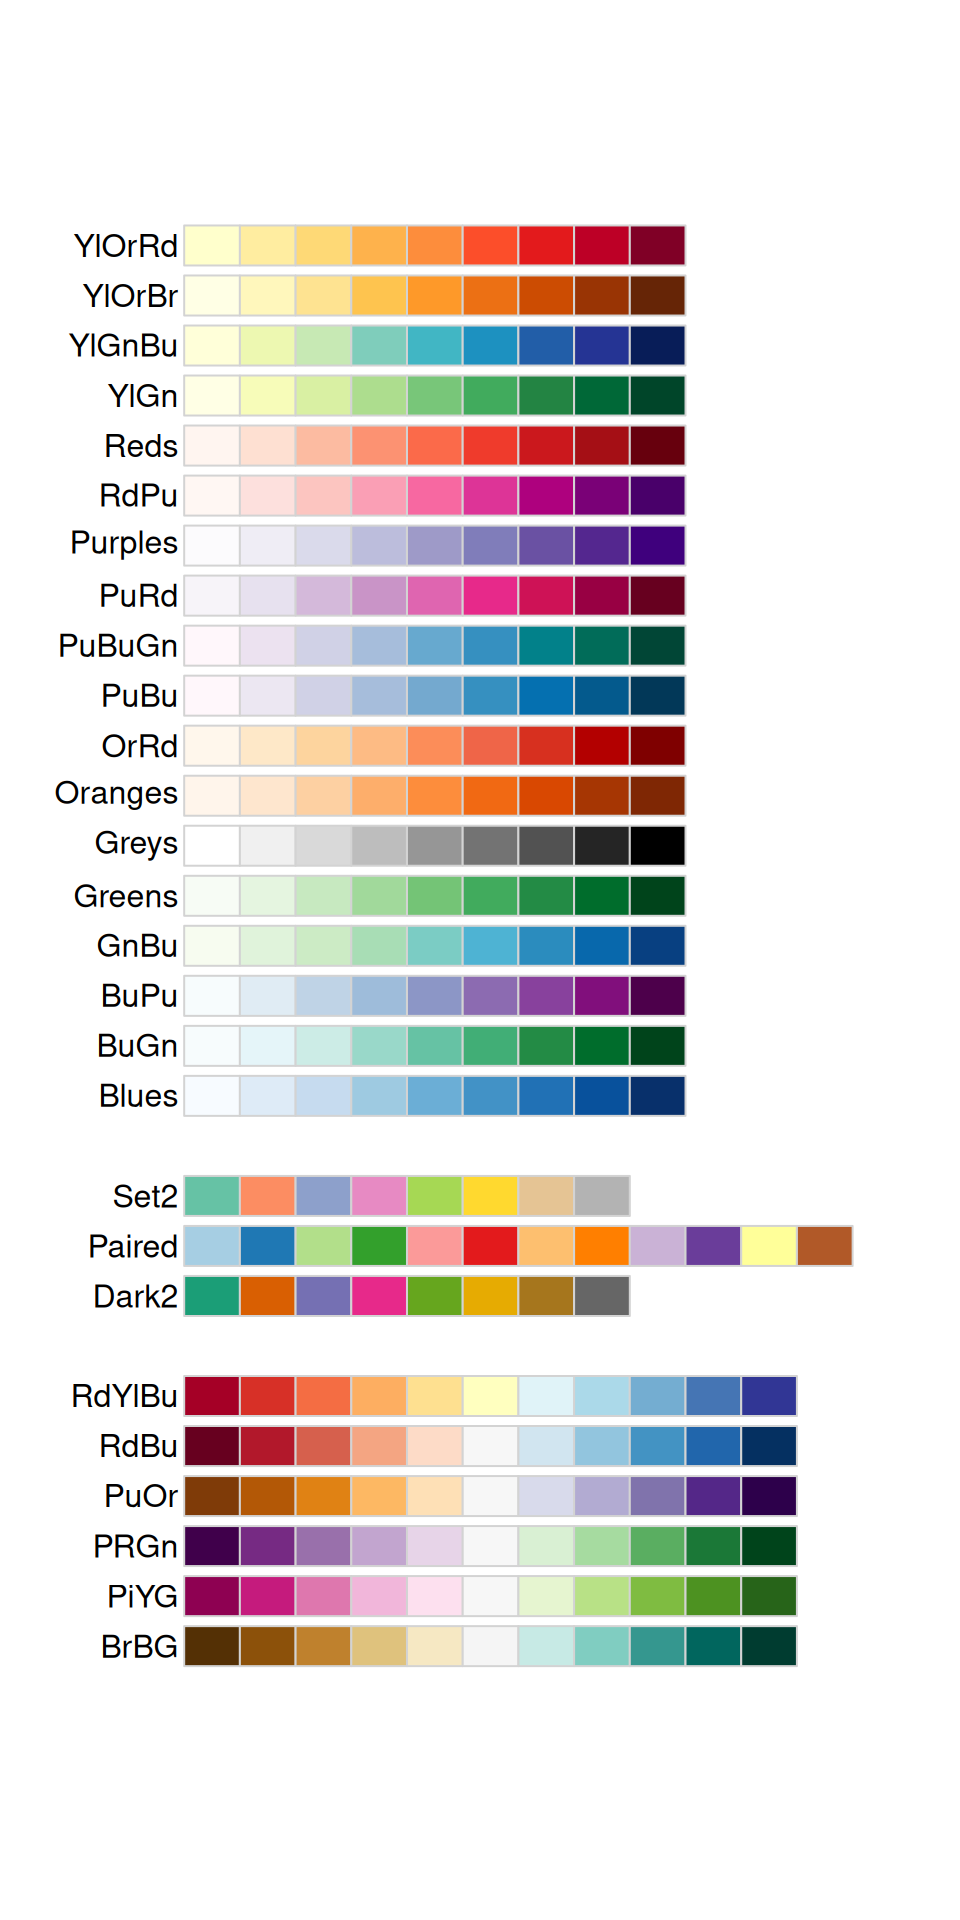
You can check which palettes are colorblind-friendly the following way:
We can easily take advantage of the RColorBrewer’s palettes in ggplot2 with :
- scale_color_brewer() layer (if you mapped variables with color in aes())
- scale_fill_brewer() layer (if you mapped variables with fill in aes())
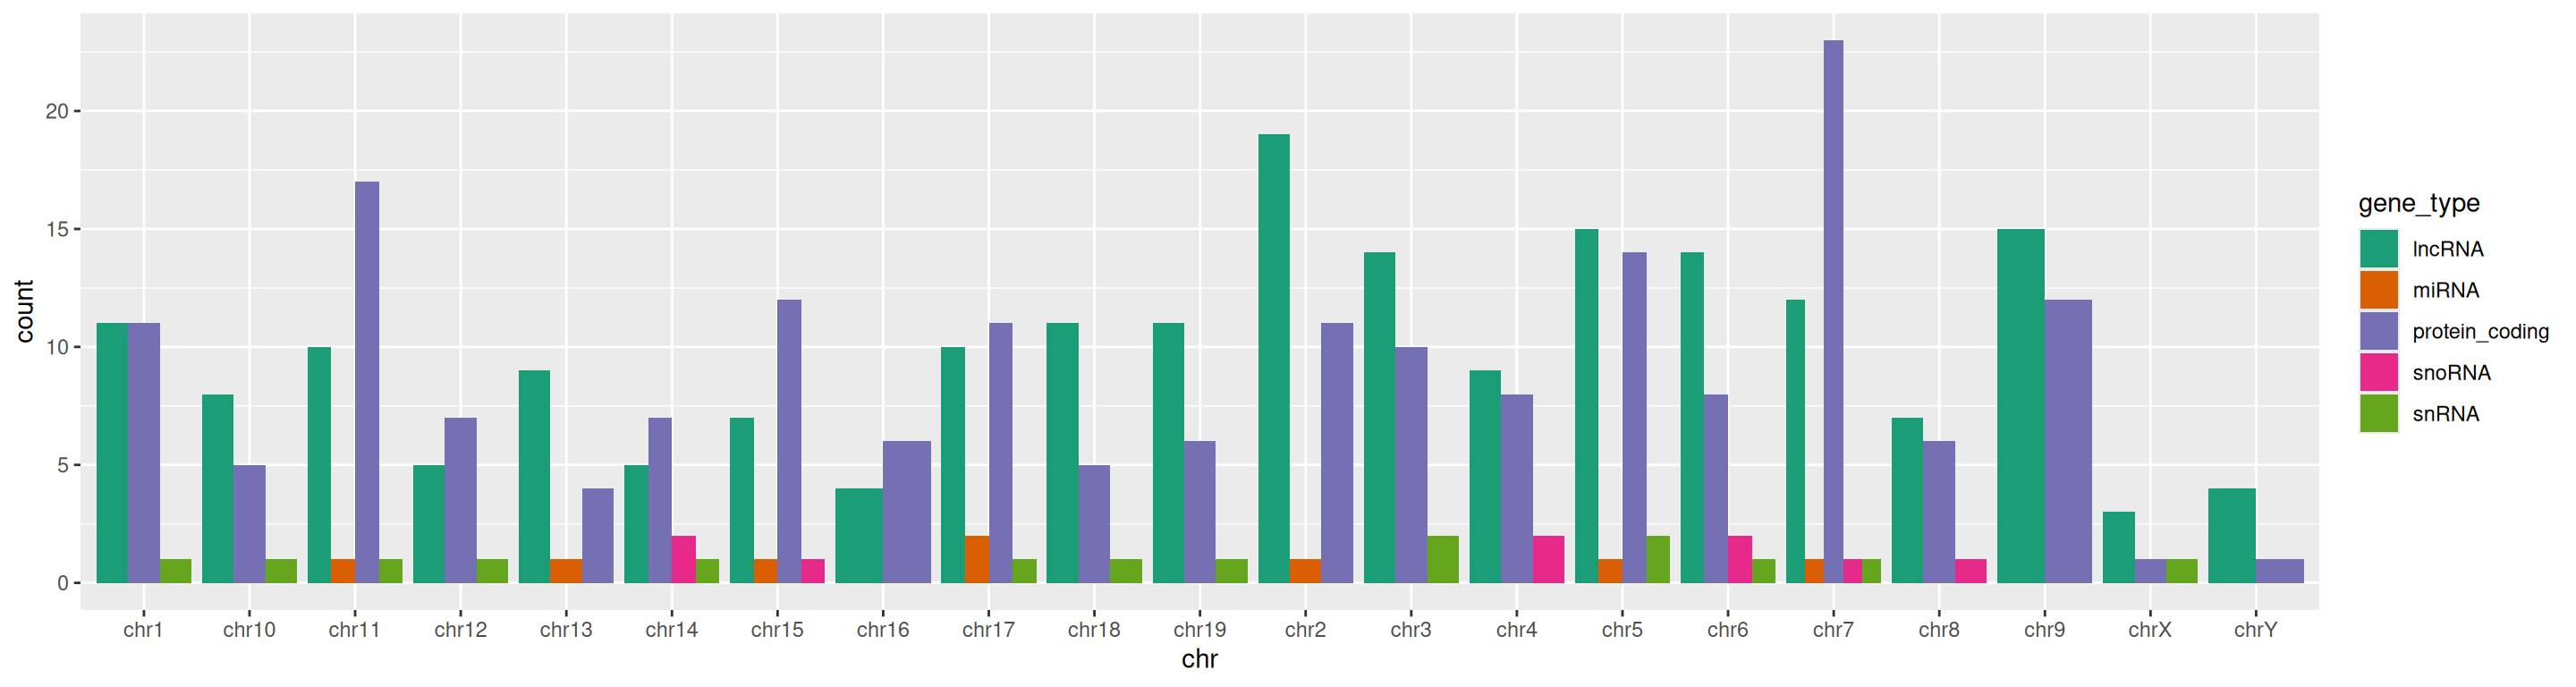
ggplot(data=gtf, mapping=aes(x=chr, fill=gene_type)) +
  geom_bar(position="dodge") +
  scale_fill_brewer()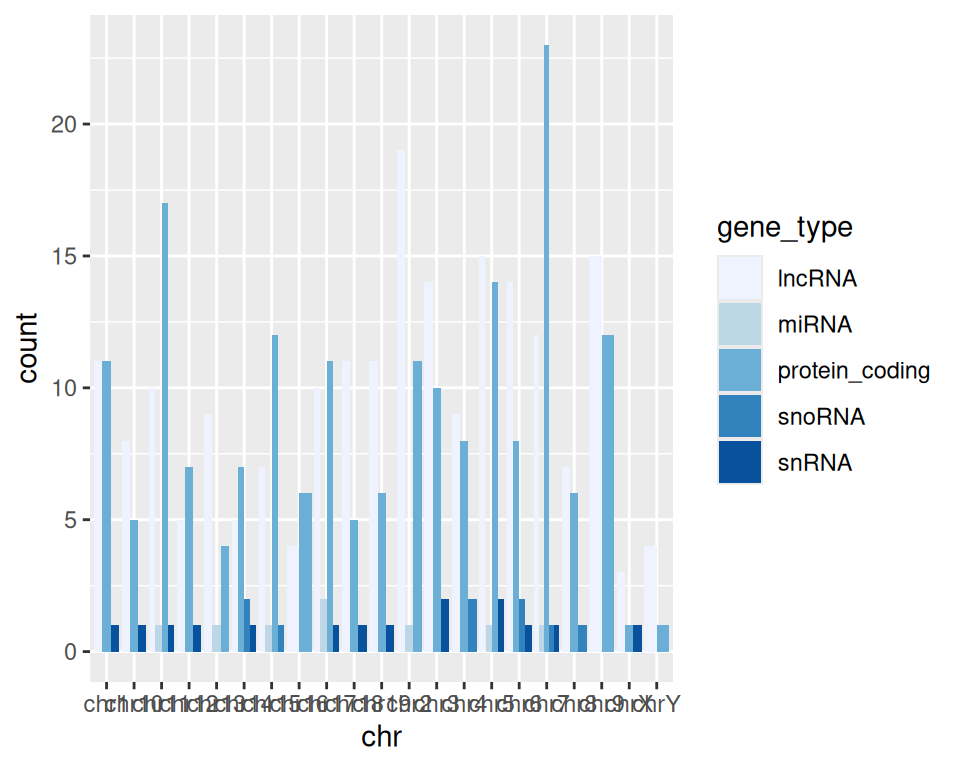
By default, the palette used is “Blues”.
How does that look using “Dark2” palette?
ggplot(data=gtf, mapping=aes(x=chr, fill=gene_type)) +
  geom_bar(position="dodge") +
  scale_fill_brewer(palette="Dark2")