12.4 Density estimates
geom_density_2d performs a 2D kernel density estimation and displays the results with contours.
ggplot(data=geneexp, mapping=aes(x=WT1, y=WT2)) +
  geom_point(color="red", size=2.5, shape="diamond") +
  ggtitle(label="my first ggplot") +
  theme_linedraw() +
  geom_density_2d()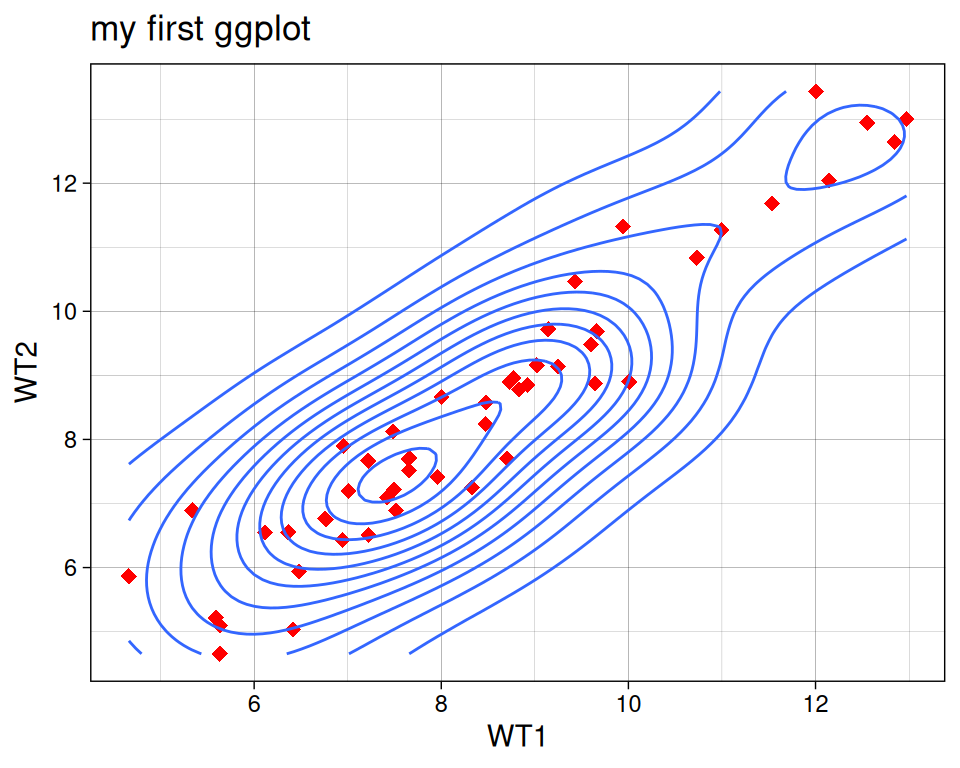
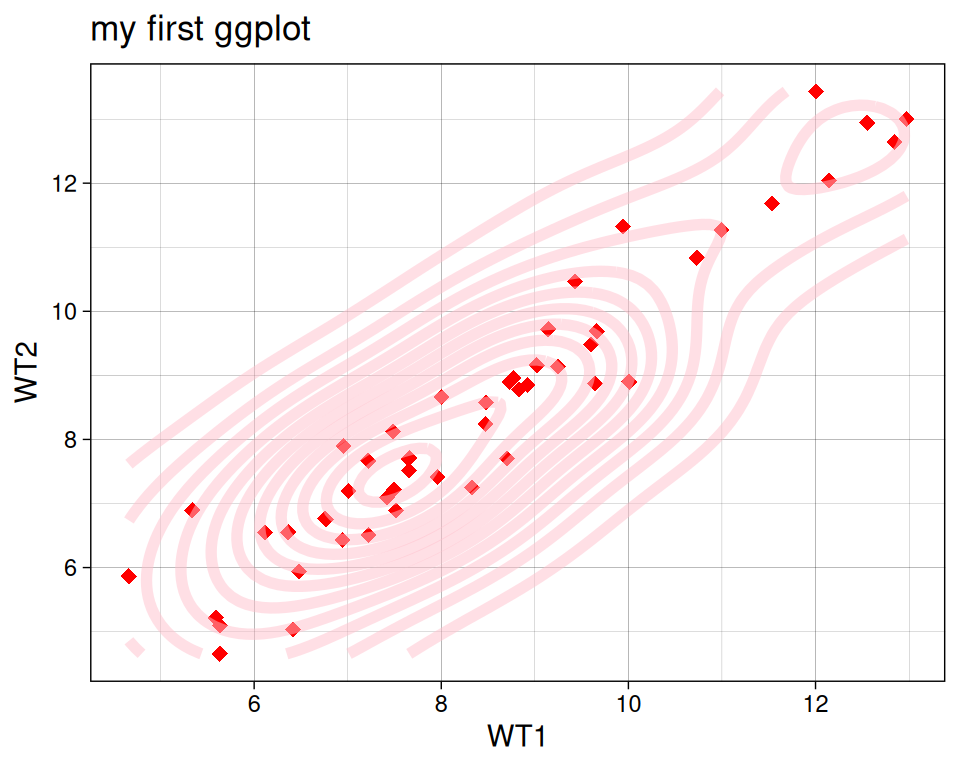
Play with some of the parameters we already know:
ggplot(data=geneexp, mapping=aes(x=WT1, y=WT2)) +
  geom_point(color="red", size=2.5, shape="diamond") +
  ggtitle(label="my first ggplot") +
  theme_linedraw() +
  geom_density_2d(color="pink", alpha=0.5, linewidth = 2)