9.1 Base plot
We can start from the geneexp object, that contains data from DEG_counts_sample.csv: we will represent WT1 on the x axis and WT2 on the y axis.
First load the ggplot2 package:
The base layer is built as follows (Copy-paste this in the console, and hit Enter):
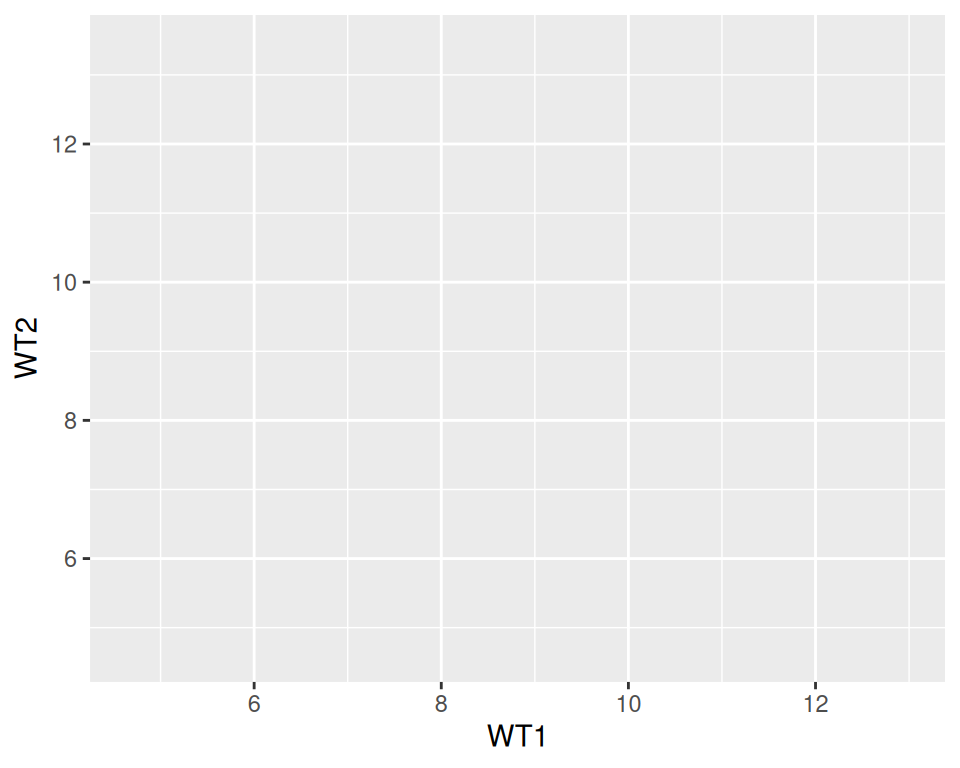
As you can see, nothing is plotted yet, but the base is set.
We then add a geometrics geom_point() to the base layer: this tells ggplot to produce a scatter/point plot:
# This line is a comment: a comment is not interpreted by R.
# Example of a scatter plot: add the geom_point() layer
ggplot(data=geneexp, mapping=aes(x=WT1, y=WT2)) +
  geom_point()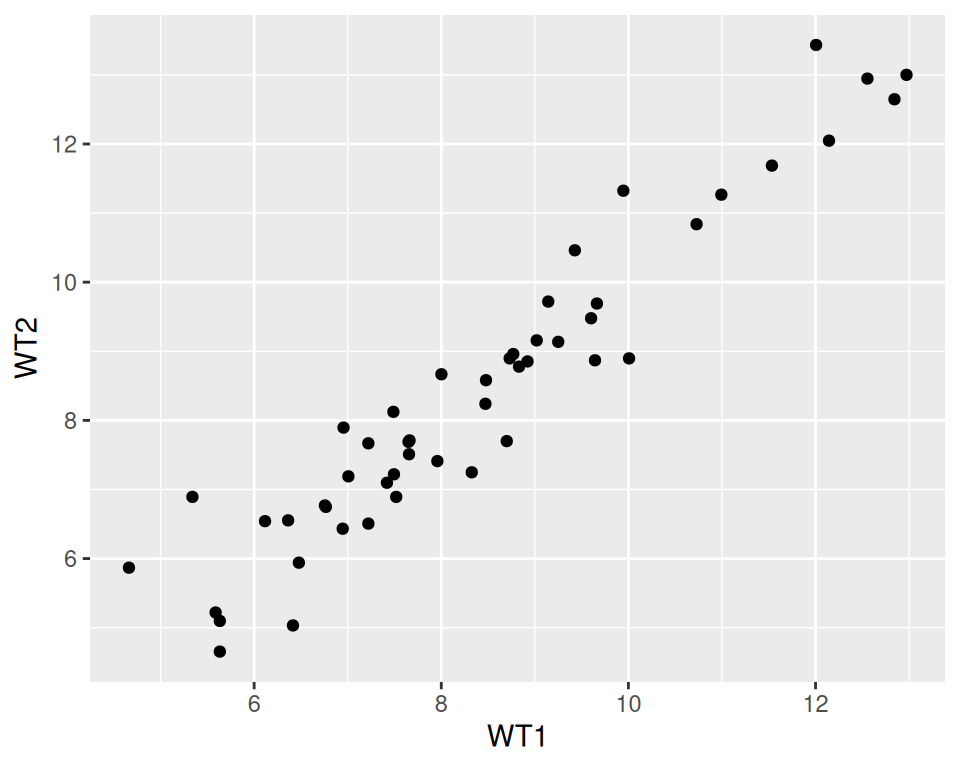
Note that the new line is NOT necessary after the “+”: it is done for clarity / readability.
Please, copy this code to your script, and execute it!
Your plot should appear in the “Plots” tab in the bottom-right panel.