23.1 Heatmaps with {pheatmap}
We will introduce package {pheatmap} to produce heatmaps.
First we can install pheatmap (bottom-right panel -> Packages -> Install).
And then we load the package: tick the package in the list, or load it from the console:
pheatmap is not from the tidyverse package, and does not follow the same structure. It does not work with layers, but with multiple parameters inside a same function.
Let’s read the following data file, and convert it to matrix (that is the input format for pheatmap):
expr_heatmap <- read_csv("GSE277039/counts_100genes.csv") %>%
  column_to_rownames(var = "GeneSymbol") %>%
  as.matrix()
You can then simply plot the heatmap, giving the matrix as an input:
Control what is clusters: rows, columns, both, or none:
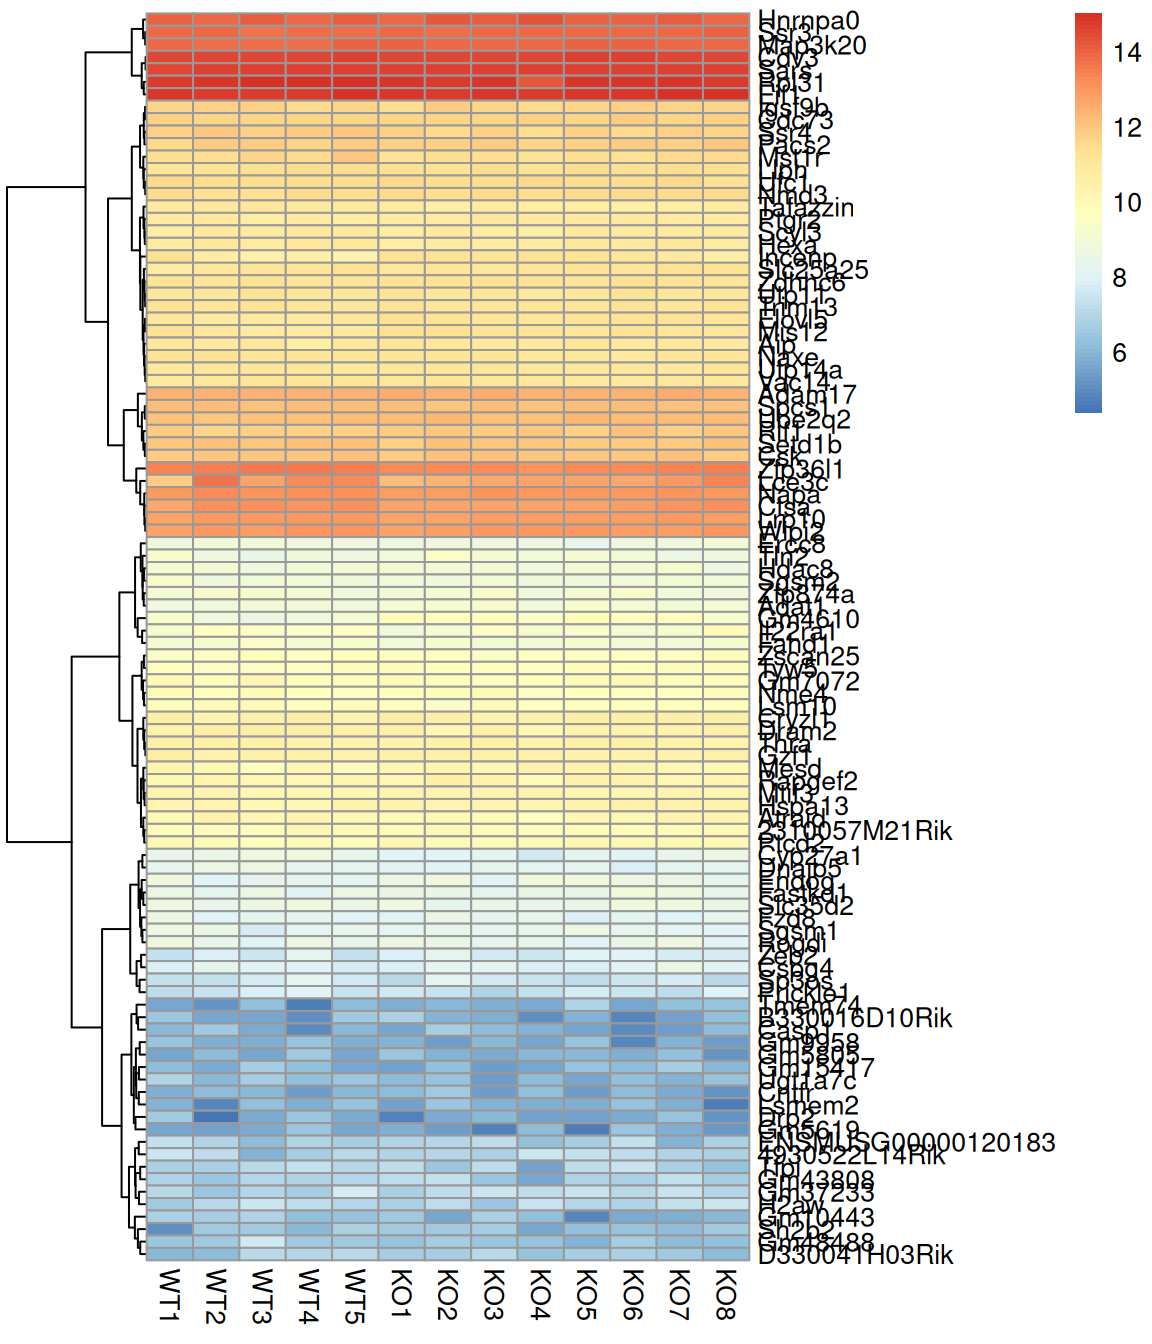
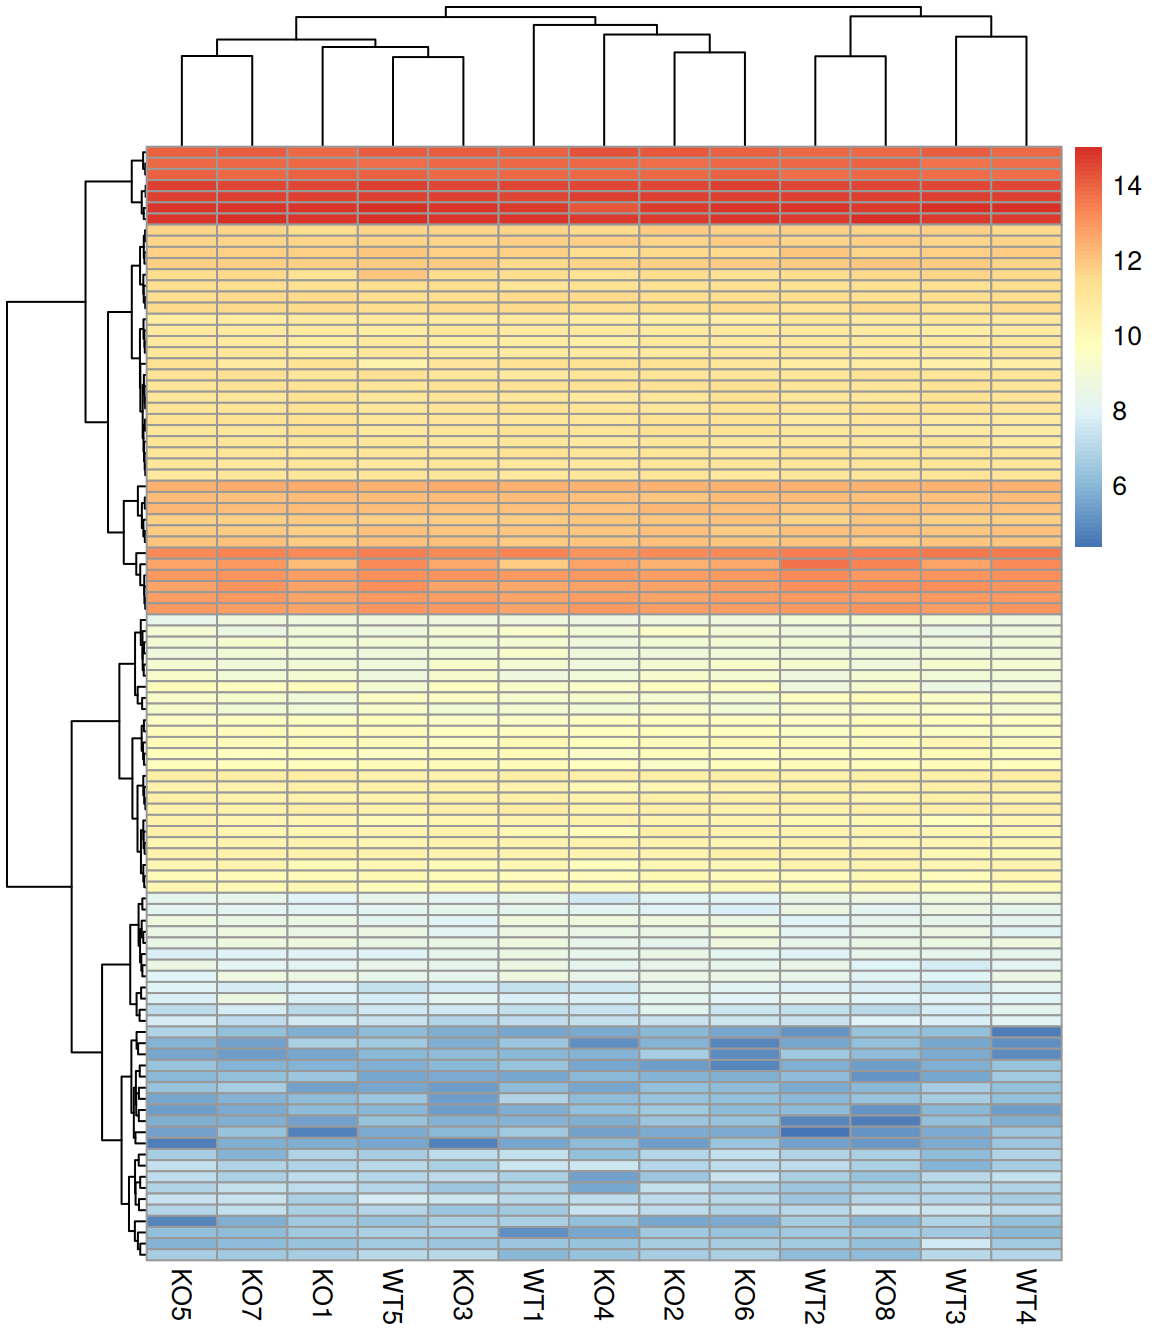
Show or hide row names:
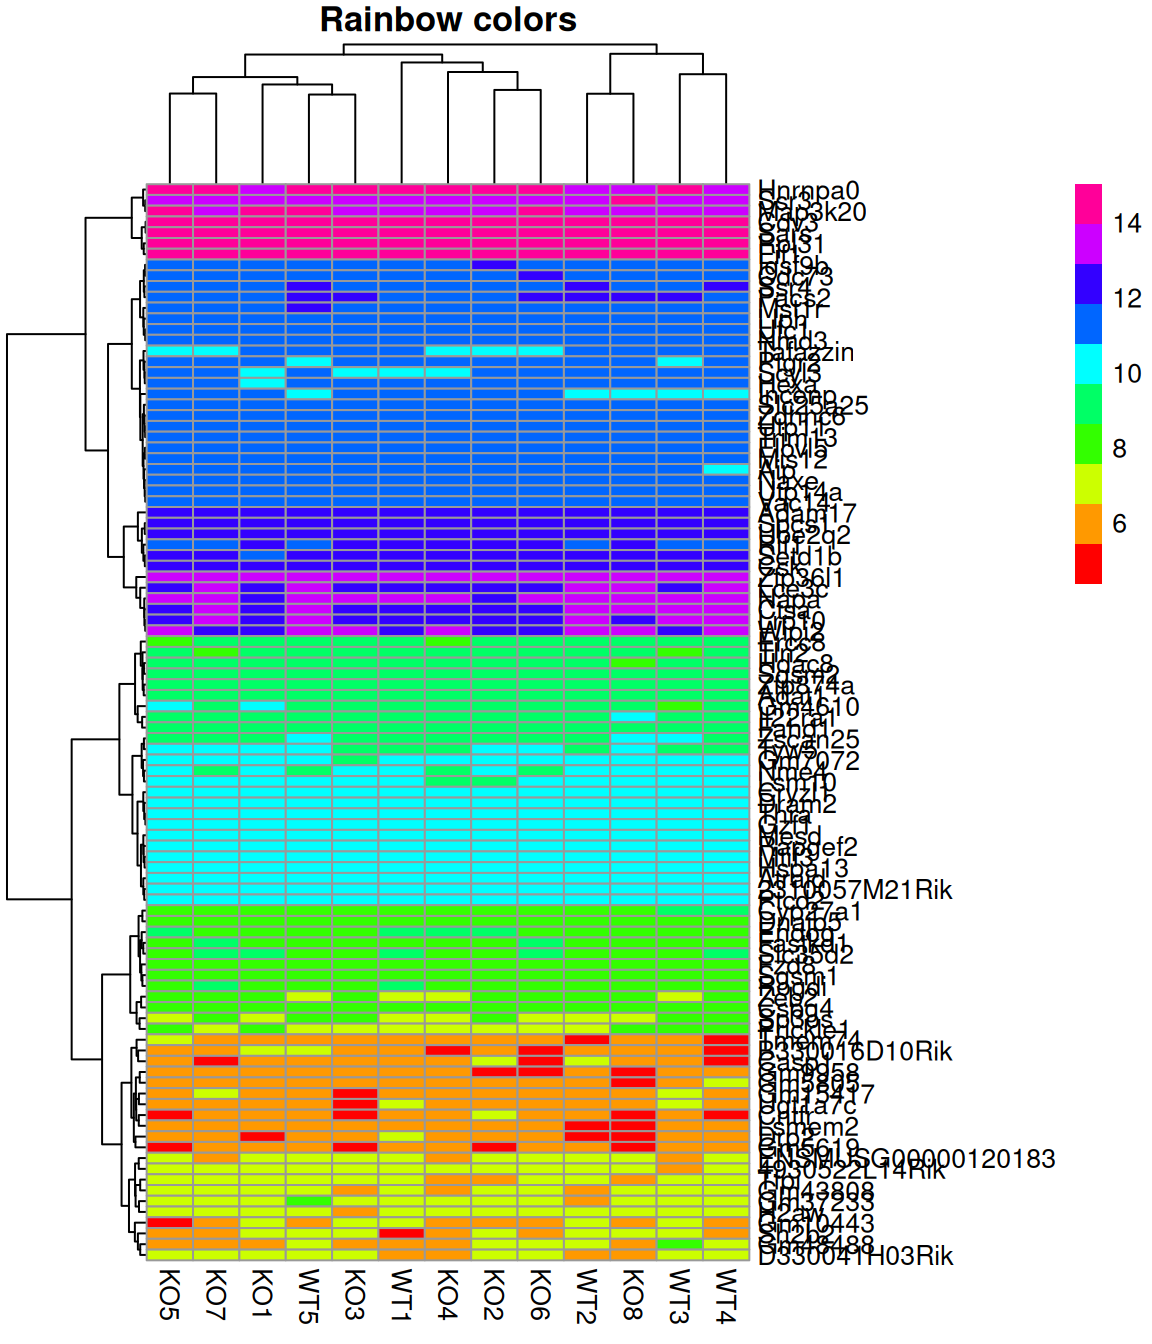
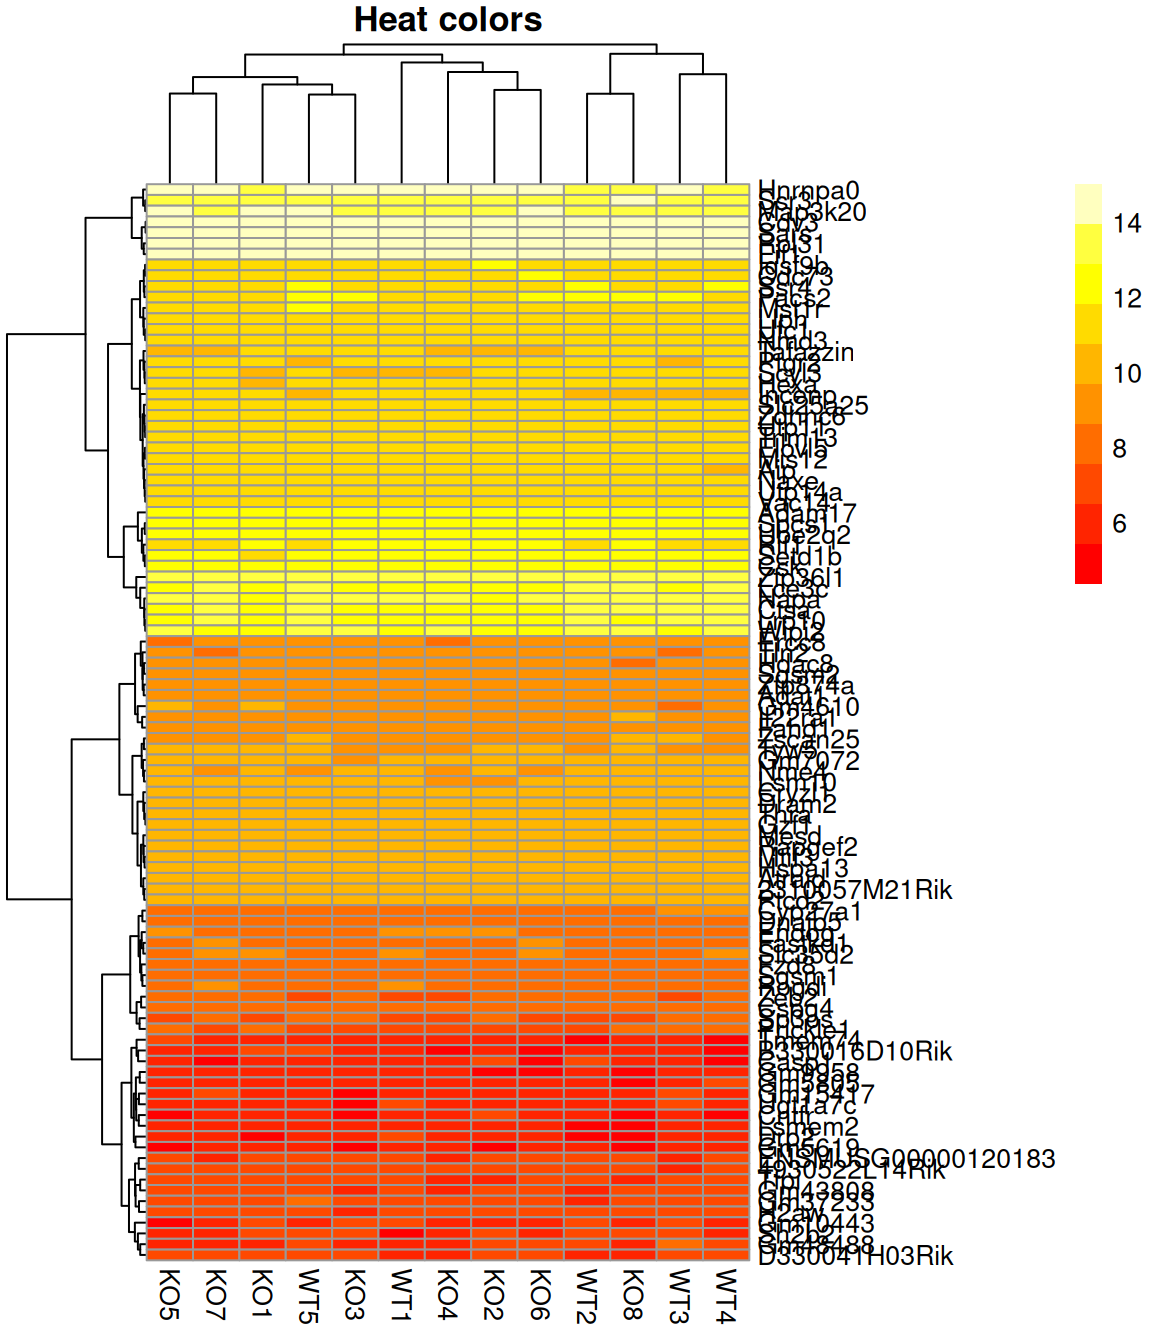
Change the color scale (rainbow() and heat.colors() are available from the base packages):