8.3 Save your plot
8.3.1 From the RStudio interface
Before we dive into more graph types, let’s pause and learn how to easily save the current plot.
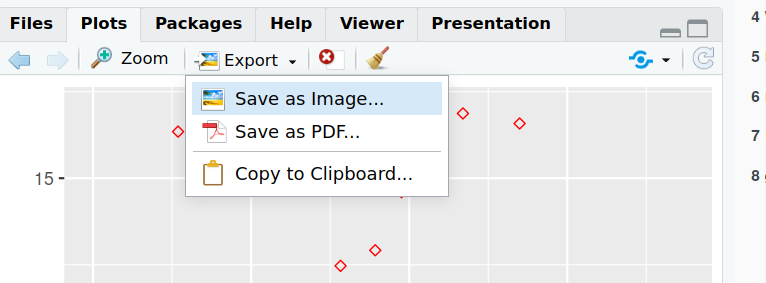
In the “Plots” tab, click on “Export” and “Save as image”:

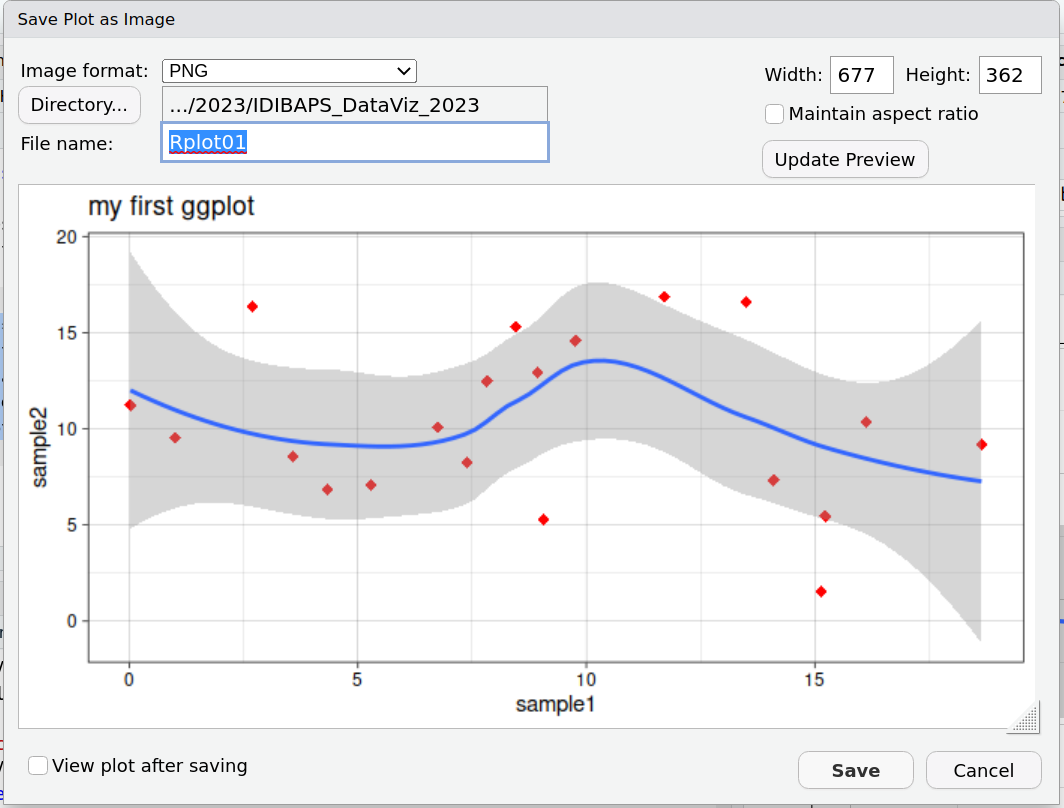
From that windows, you can:
- Pick an image format between: PNG, JPEG, TIFF, BMP, SVG, EPS.
- Choose where you want to save the output file (by default, R will propose the current working directory).
- Choose the file name.
- Set the dimensions, by either:
- Setting the Width and Height of the figure (in pixels)
- Moving the graph manually (bottom-right corner of the plot) until you obtain the size and proportions that you want.

8.3.2 From the console
The best way to save a plot to a few from the console, is using the ggsave function.
First, you need to save the plot to an object (if you don’t, ggplot will create a file from the latest plot, which is fine too!).
myplot <- ggplot(data=geneexp, mapping=aes(x=sample1, y=sample2)) +
  geom_point(color="red", size=2.5, shape="diamond") +
  ggtitle(label="my first ggplot")
Many different formats are available:
- eps
- ps
- tex
- jpeg
- tiff
- png
- bmp
- svg
- wmf
You can specify the plot size units between inches “in”, centimeters “cm”, milimeters “mm” or pixels “px”.
You can also specify the dpi, i.e. dots per inches.
If we take as an example the requirements of electronic image formats for Nature publishing group:
“Layered Photoshop (PSD) or TIFF format (high resolution, 300–600 dots per inch (dpi) )”
We could save the plot as a file the following way: