11.1 Exercise 5: barplot
- Import DataViz_source_files-main/files/population_age_group_per_sex_long_format.csv into an object called pop_age.
correction
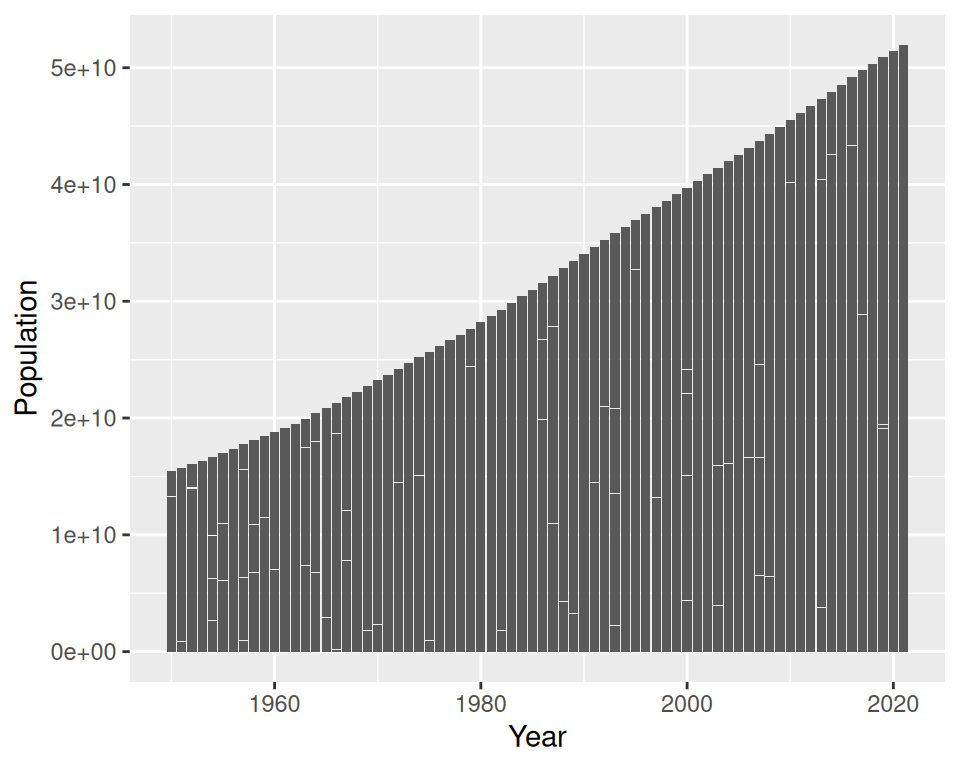
- Create a barplot that shows the population count per Year:
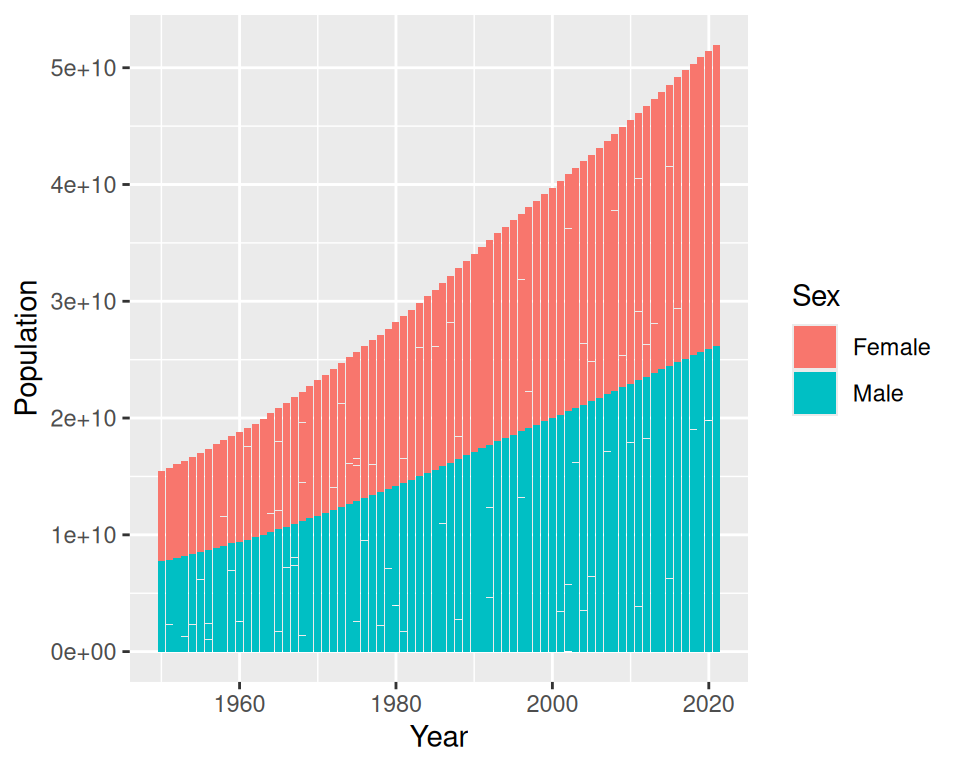
- Split boxes per Sex (in the same plot: do not split into different plots):
correction
- Keep only data that corresponds to “Spain”. You can do this in 2 steps: filter first, then plot.
correction
pop_age_spain <- filter(pop_age, Country=="Spain")
ggplot(data=pop_age_spain, mapping=aes(x=Year, y=Population, fill=Sex)) +
  geom_bar(stat="identity")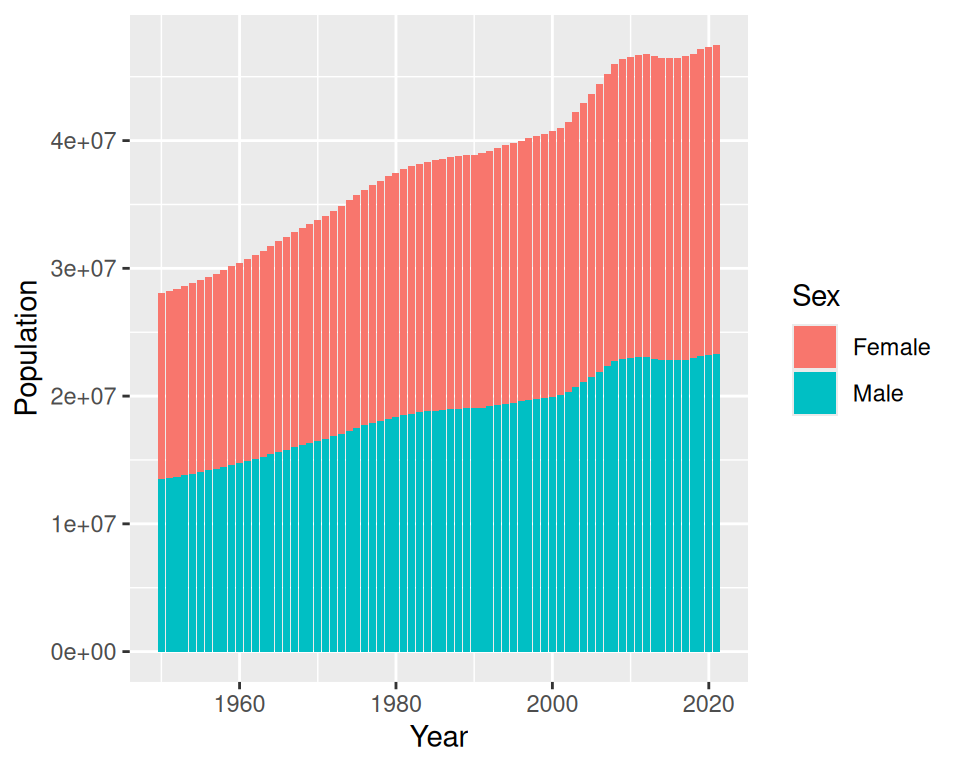
- Display the bars next to each other:
correction
ggplot(data=pop_age_spain, mapping=aes(x=Year, y=Population, fill=Sex)) +
  geom_bar(stat="identity", position="dodge")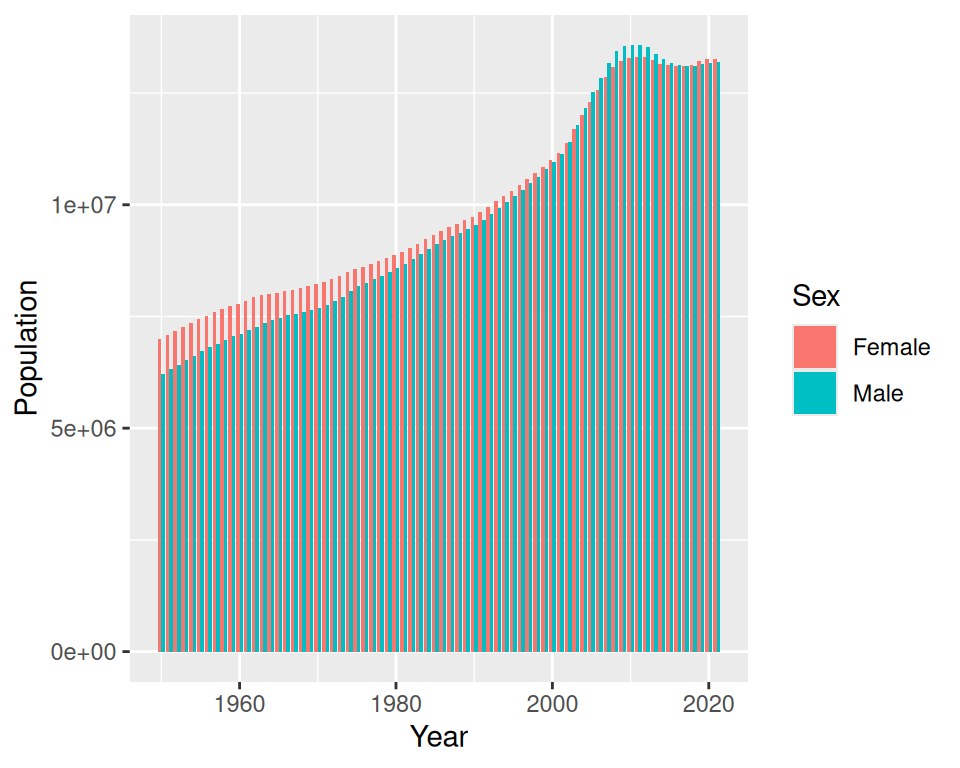
- Change default colors using scale_fill_manual() layer.
The structure is not easy to remember: take a peek at the answer!
correction
ggplot(data=pop_age_spain, mapping=aes(x=Year, y=Population, fill=Sex)) +
  geom_bar(stat="identity", position="dodge") +
  scale_fill_manual(values=c(Female="darkgreen", Male="red"))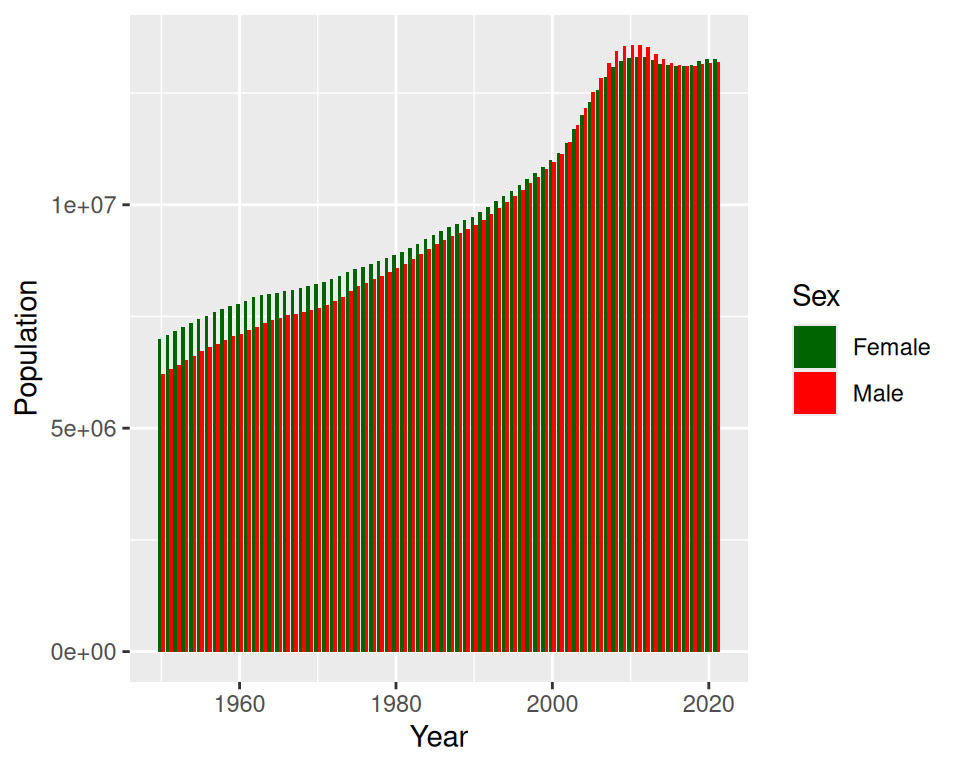
- Add a title, change the theme / background:
correction
ggplot(data=pop_age_spain, mapping=aes(x=Year, y=Population, fill=Sex)) +
  geom_bar(stat="identity", position="dodge") +
  scale_fill_manual(values=c("darkgreen", "red")) +
  ggtitle("Spanish population from 1950 to 2021 per sex") +
  theme_minimal()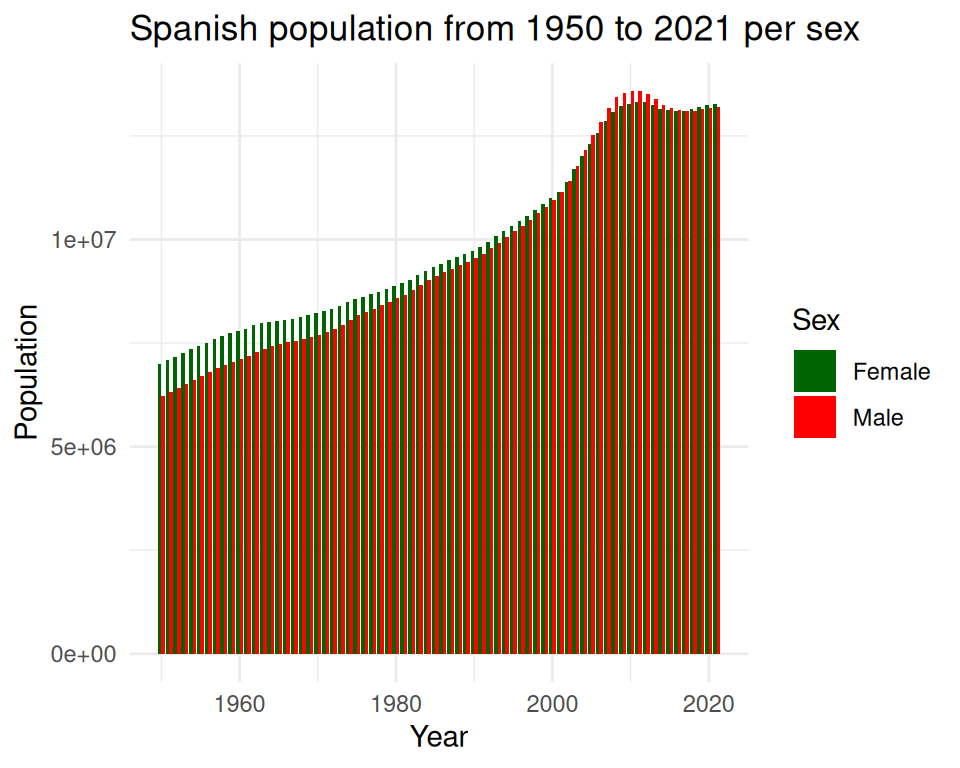
8. Create one plot per Age group using facet_wrap()
correction
ggplot(data=pop_age_spain, mapping=aes(x=Year, y=Population, fill=Sex)) +
  geom_bar(stat="identity", position="dodge") +
  scale_fill_manual(values=c("darkgreen", "red")) +
  ggtitle("Spanish population from 1950 to 2021 per sex") +
  theme_minimal() +
  facet_wrap(~Age_group)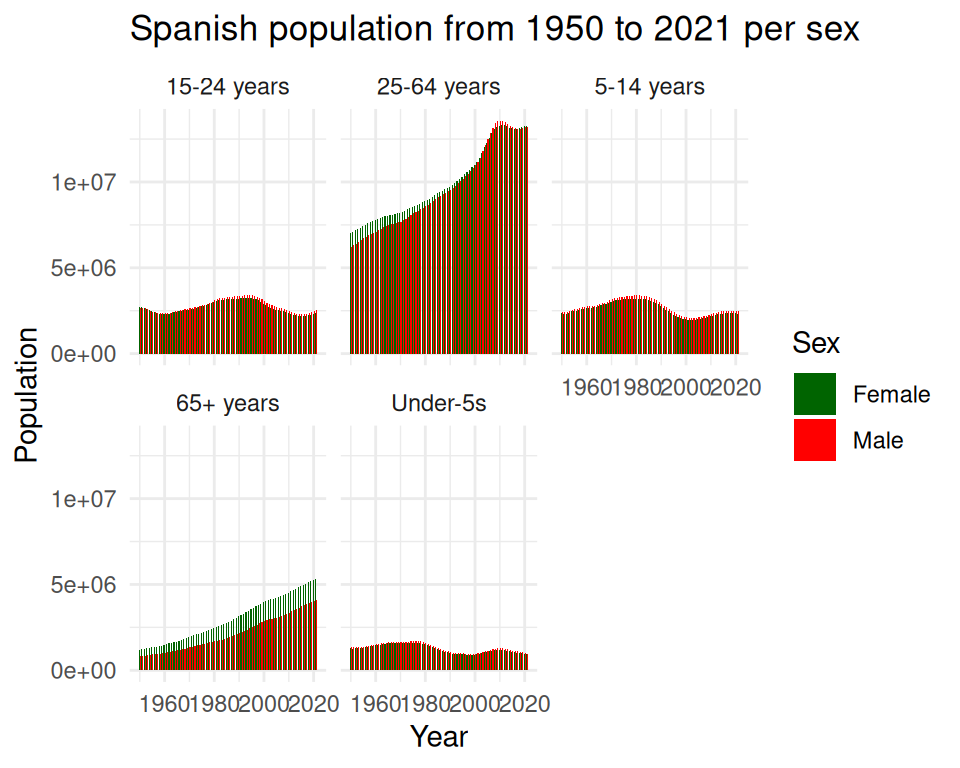
- Save to a PDF file: Export -> Save as PDF. Note: when saving to PDF format, you cannot manualy drag the plot to get the size and proportion you want, but you can Preview before saving it.
If you prefer, you can save the file using ggsave() (or you can do both!).
correction
# first, save to an object
plot_age <- ggplot(data=pop_age_spain, mapping=aes(x=Year, y=Population, fill=Sex)) +
  geom_bar(stat="identity", position="dodge") +
  scale_fill_manual(values=c("darkgreen", "red")) +
  ggtitle("Spanish population from 1950 to 2021 per sex") +
  theme_minimal() +
  facet_wrap(~Age_group)

# save file
ggsave(filename="population_age_sex_Spain.pdf", plot=plot_age, device = "pdf", units = "in", width = 10, height = 8)- Save your filtered data as a .csv file: have a look at the write_csv() function from {readr}: