11.3 Exercise 7: boxplot
- Convert DataViz_source_files-main/files/GSE150029_rnaseq_log2.csv (rnaseq object) to a long format, and save it as a new object called rnaseq2.
Note that it exists already as a separate object, if you prefer to read this in directly: DataViz_source_files-main/files/GSE150029_rnaseq_log2_long.csv.
correction
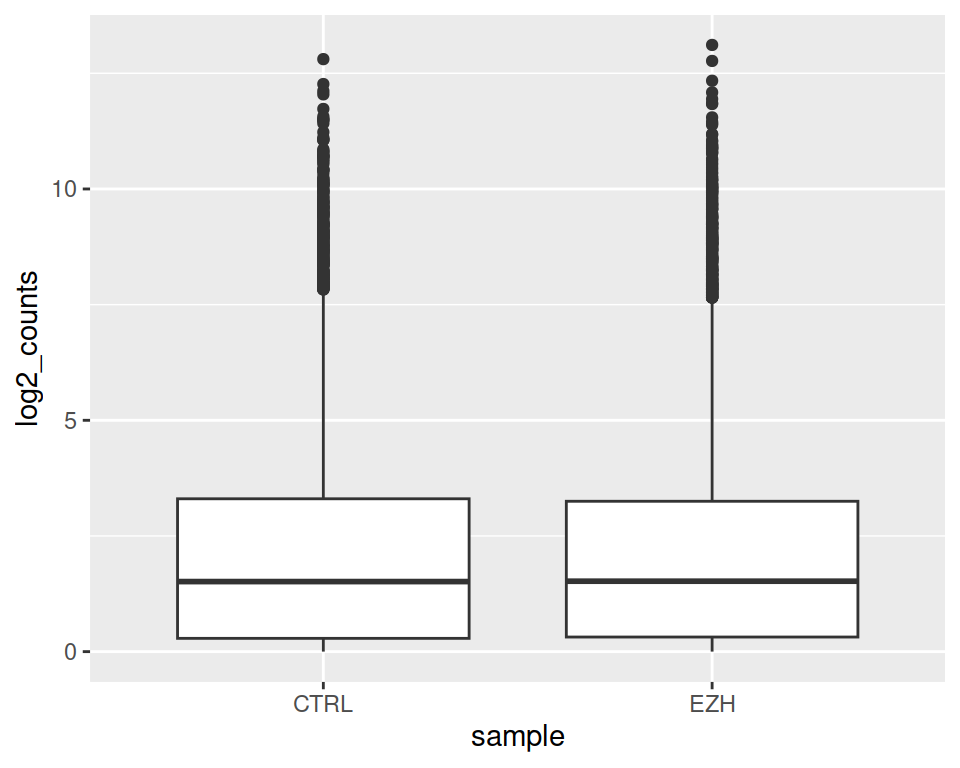
- Create a boxplot that will represent the samples on the x axis, and their expression on the y axis.
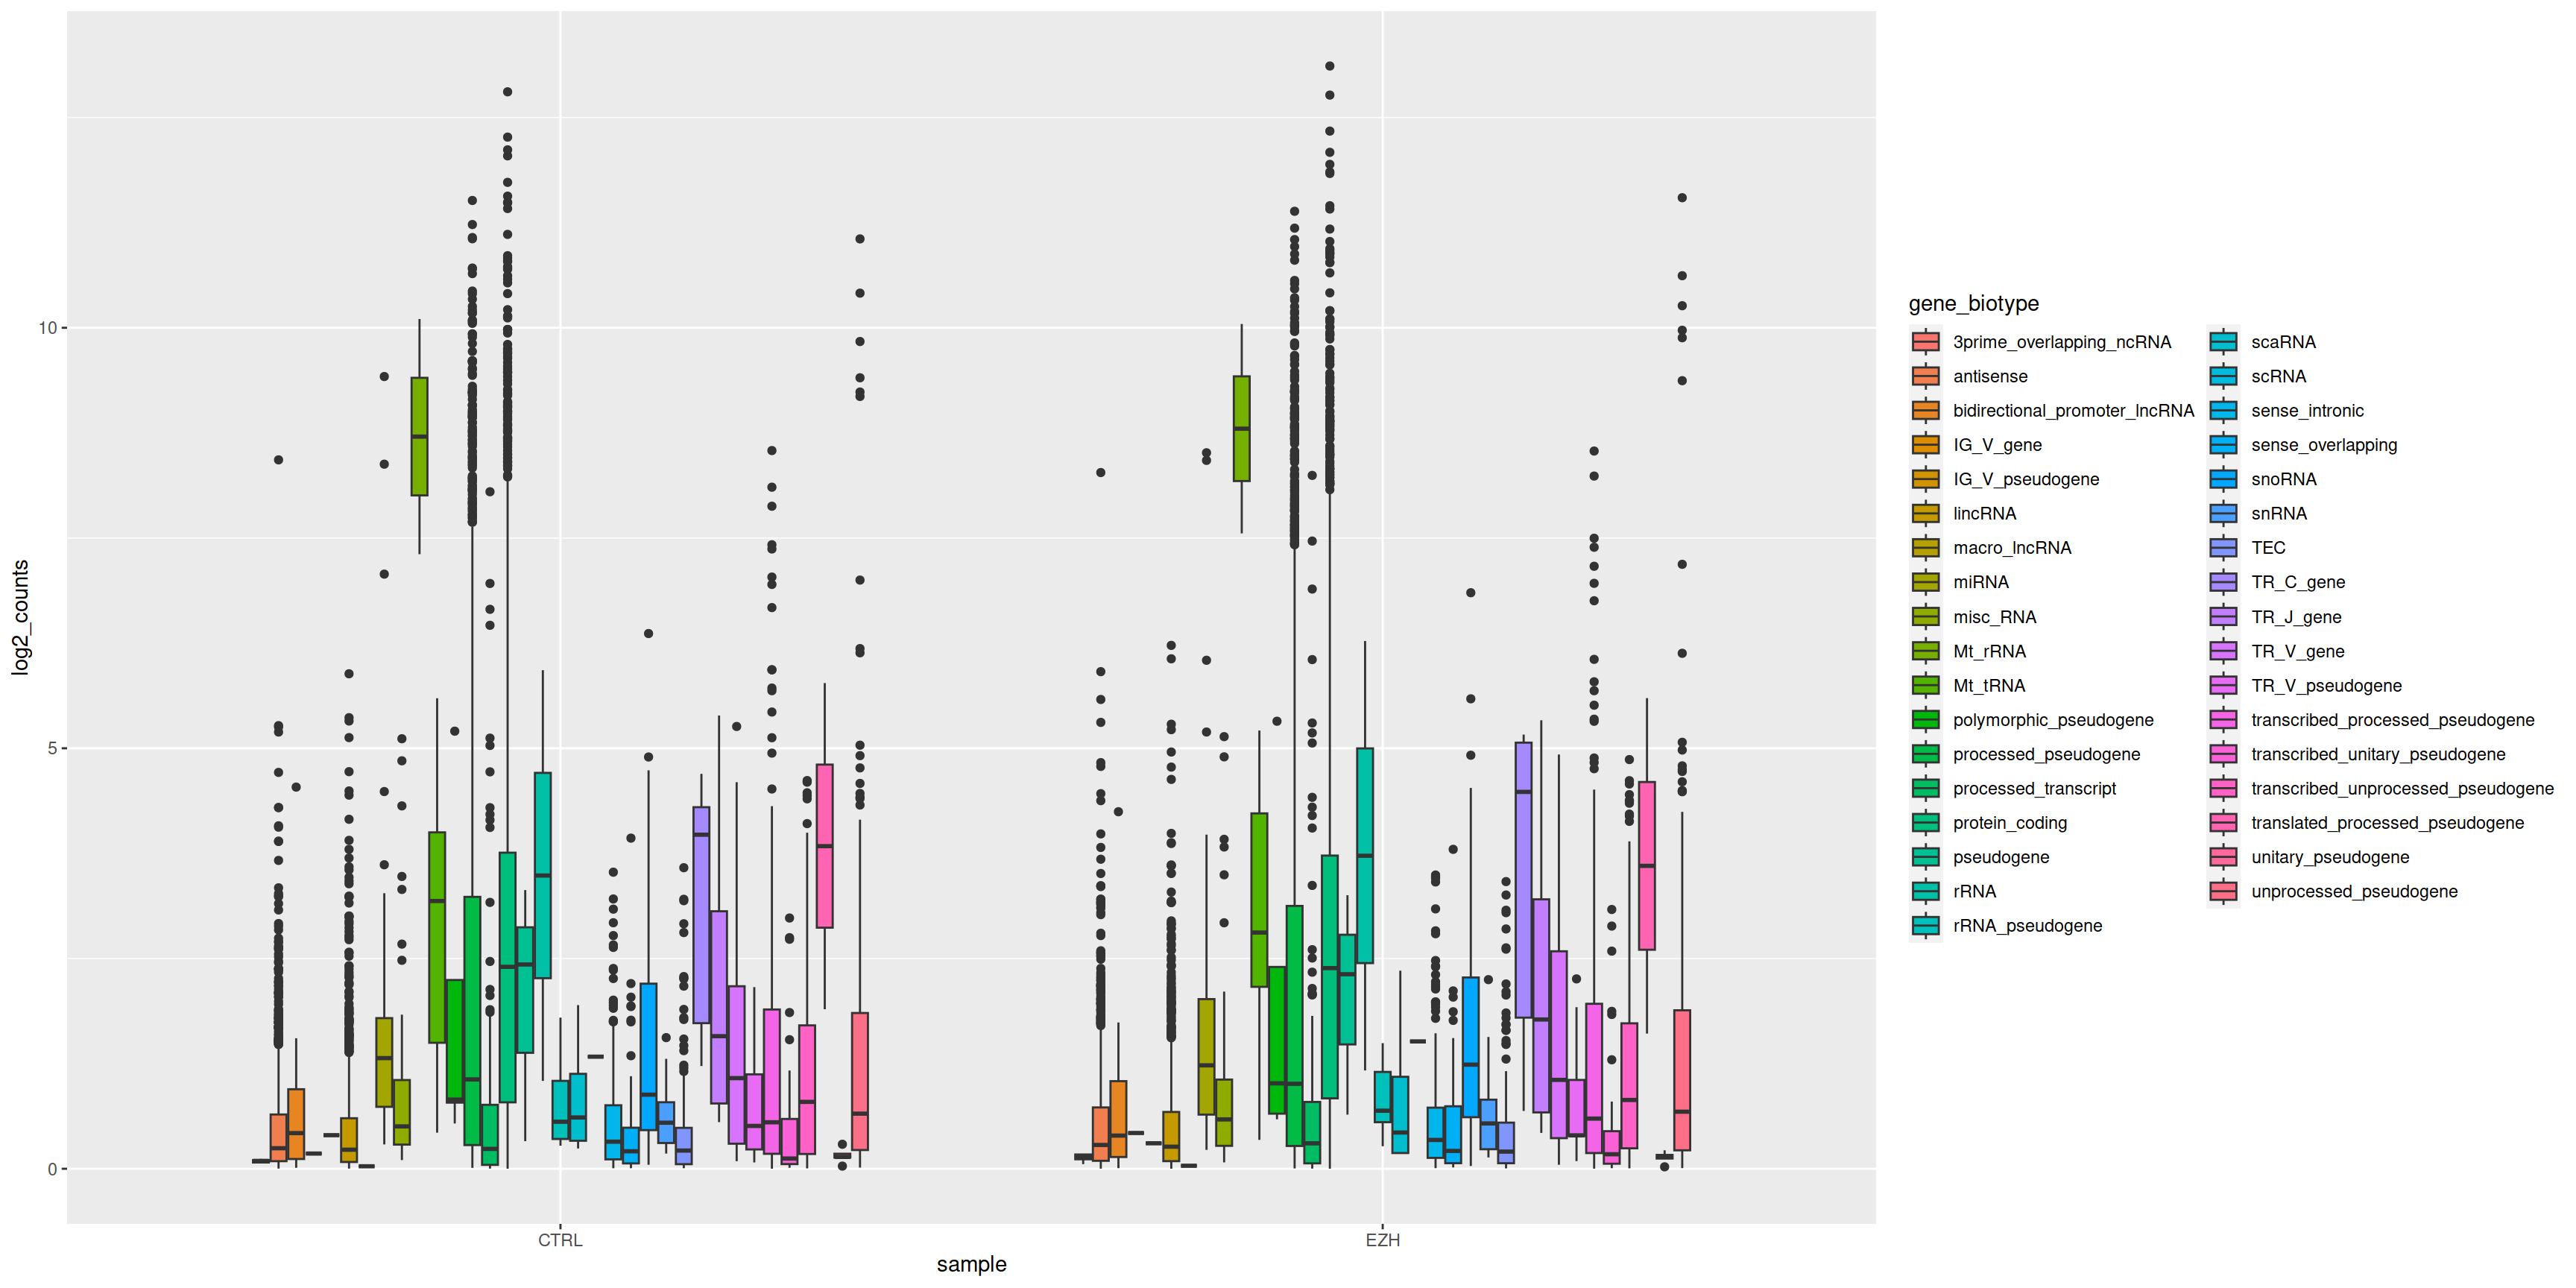
- Split the boxes per gene_biotype.
correction
- Select only protein_coding and lincRNA and split again the boxes per gene_biotype.
correction
filter(rnaseq2, gene_biotype=="protein_coding" | gene_biotype=="lincRNA") %>% ggplot(mapping=aes(x=sample, y=log2_counts, fill=gene_biotype)) +
  geom_boxplot()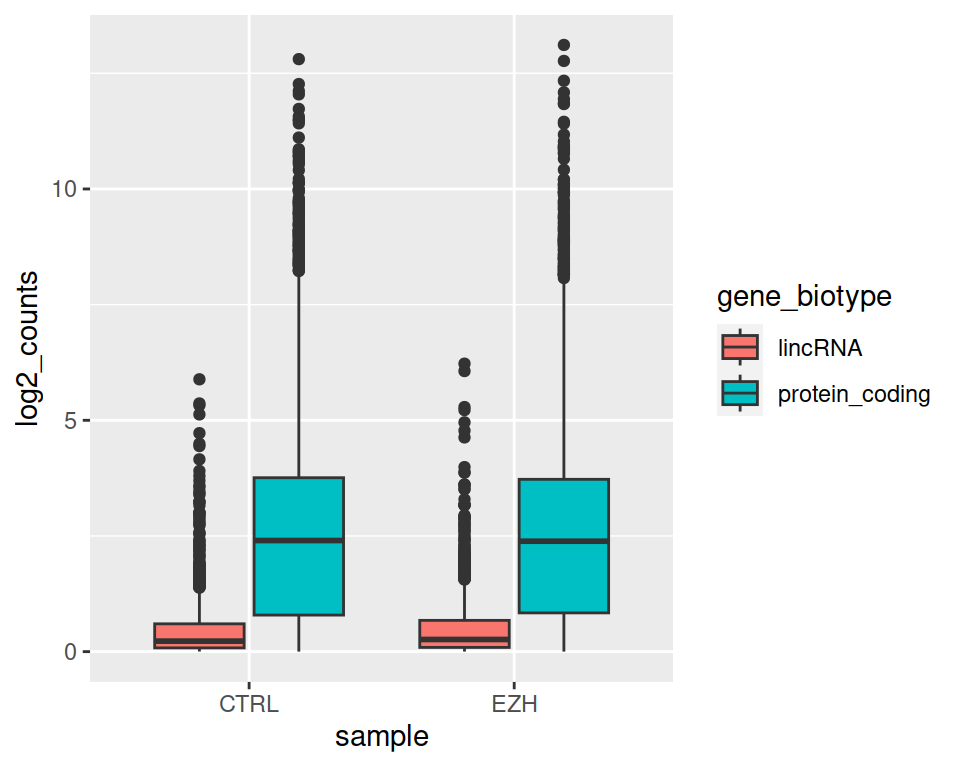
- Add a geom_violin() layer. Set alpha=0.3 in geom_violin. What is the alpha parameter?
correction
filter(rnaseq2, gene_biotype=="protein_coding" | gene_biotype=="lincRNA") %>% ggplot(mapping=aes(x=sample, y=log2_counts, fill=gene_biotype)) +
  geom_boxplot() +
  geom_violin(alpha=0.3)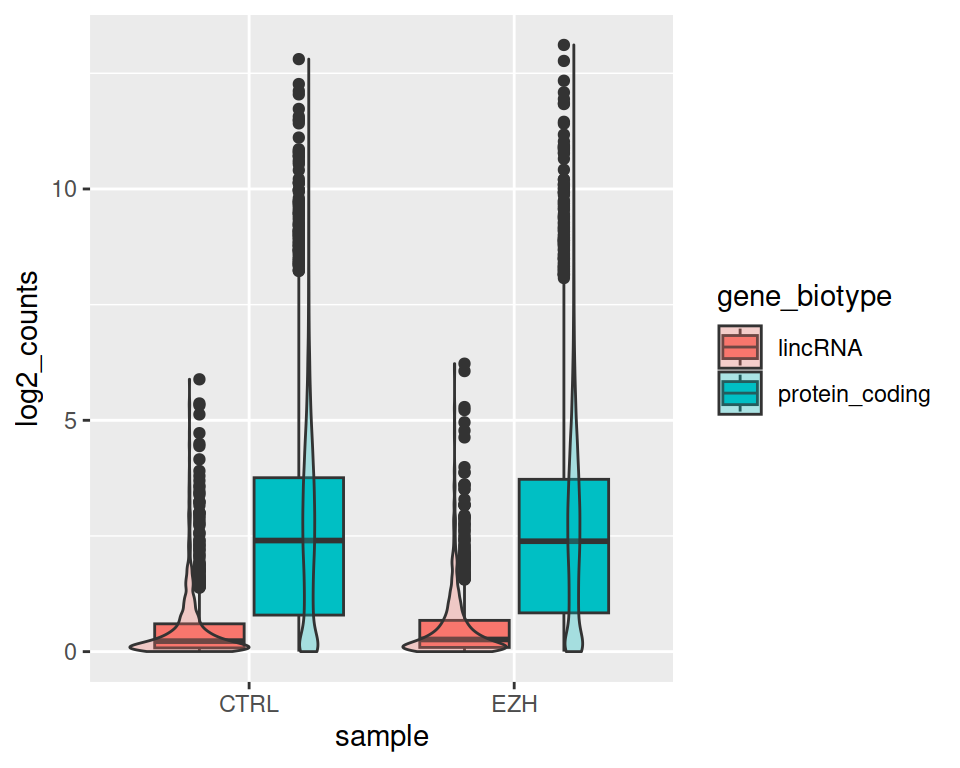
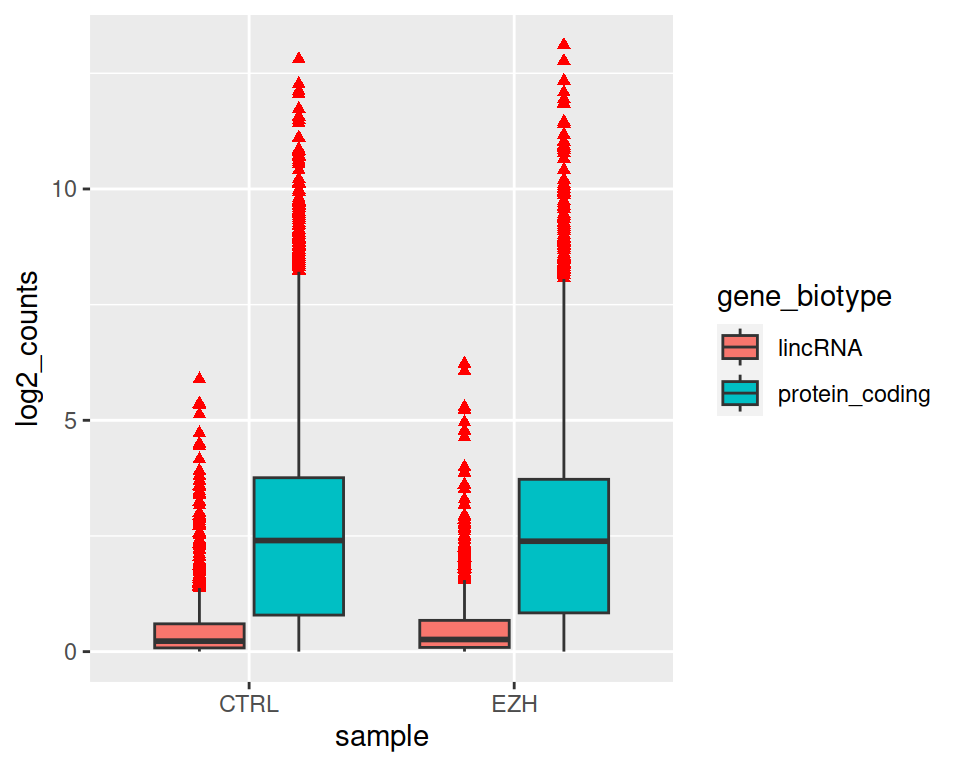
- Look at the help page of geom_boxplot() and change the following parameters:
- Set outlier color to red
- Set outlier shape as triangles